UThe race to modernize money is no longer theoretical. Around the world, leading financial institutions are actively rolling out blockchain-based tokenized deposits that turn ordinary bank balances into programmable, always-on digital money.
On one side, Ant International is collaborating closely with HSBC to launch tokenized deposit services for real-time treasury and cross-border payments in Hong Kong and beyond, using its blockchain-powered Whale platform. On the other hand, UBS is driving a parallel wave of experimentation in Europe and Switzerland, completing the first legally binding inter-bank payment using tokenized bank deposits on a public blockchain alongside PostFinance and Sygnum Bank under the Swiss Bankers Association.
Taken together, these initiatives show how large global players such as Ant International and UBS are effectively “teaming up” at an ecosystem level to make blockchain-based tokenized deposits a practical reality. They are not merely talking about digital assets and distributed ledger technology (DLT); they are already moving real money, for real clients, under real regulation.
What Are Blockchain-Based Tokenized Deposits?
At their core, tokenized deposits are simply traditional banks. Deposits are represented as digital tokens on a blockchain. Instead of changing the nature of the money itself, they change the rails it travels on.
In a conventional setup, when a company sends money internationally, that payment hops through correspondent banks, batch systems, and cut-off times. Settlement may take days, and treasury teams juggle reconciliation, FX risk, and liquidity buffers. With blockchain-based tokenized deposits, the process looks very different. A corporation’s cash balance at a bank is mirrored as on-chain tokens issued by that bank.
When the company initiates a payment or internal transfer, the bank converts a portion of the deposit into a token on its DLT platform, the token moves across the blockchain almost instantly to the recipient’s wallet or account representation, and the bank updates its core ledger so that the token and the underlying deposit stay perfectly synchronized.
It is easy to confuse tokenized deposits, stablecoins, and central bank digital currencies (CBDCs), but they play different roles. Stablecoins are typically issued by private entities and may be backed by reserves; they are not direct claims on a bank deposit account unless specifically structured that way.
CBDCs are digital money issued by central banks, representing a claim on the central bank itself. Blockchain-based tokenized deposits remain a claim on a commercial bank, just like a normal deposit. The novelty is that the claim is represented and moved as a token on a blockchain.
Ant International’s Role: From Digital Payments to On-Chain Treasury
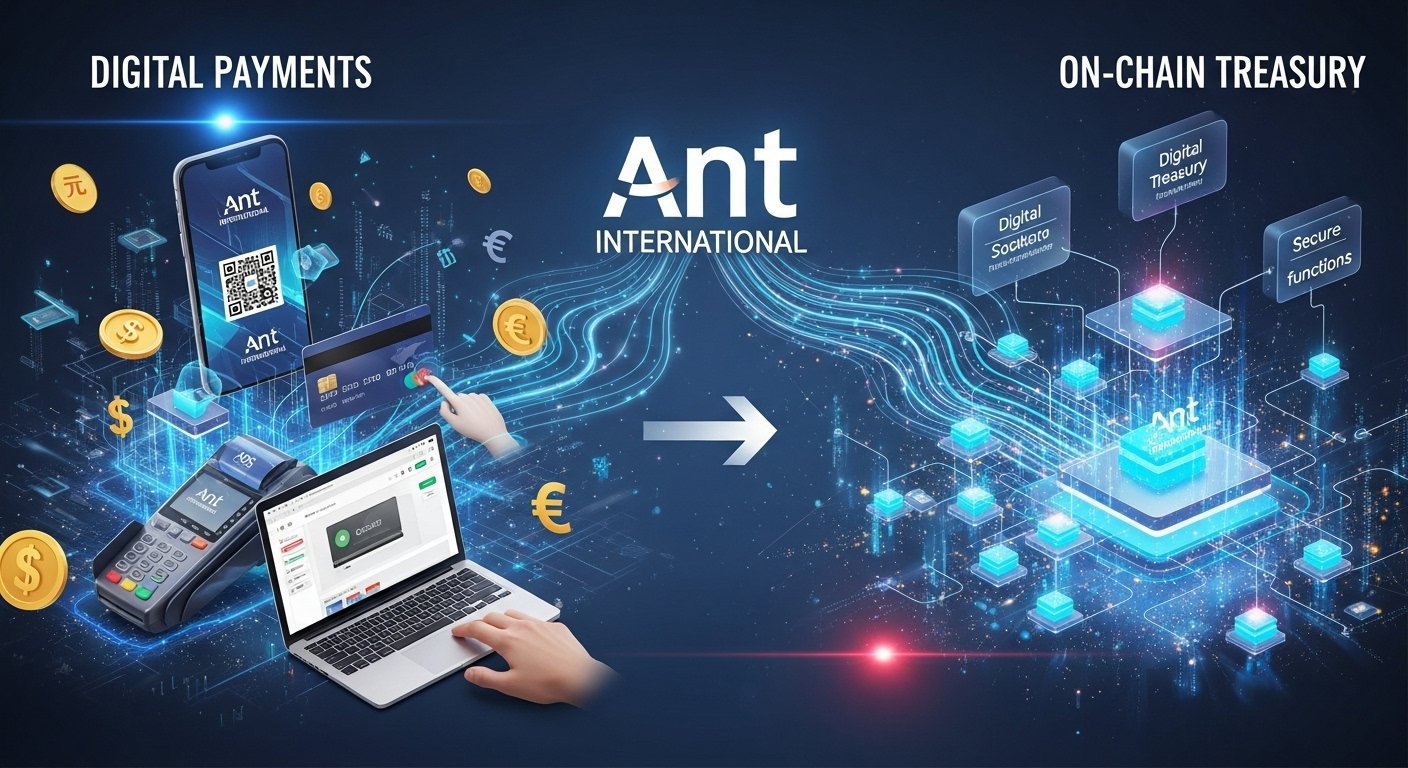
Ant International is best known as the global arm of Ant Group, building digital payment and embedded finance solutions across Asia, Europe, the Middle East, and Latin America. In recent years, it has quietly become a powerhouse in blockchain-based treasury management.
A central piece of the story is Ant’s Whale platform, described as a next-generation treasury system that uses blockchain, advanced encryption, and AI to move funds between Ant’s entities in real time. On Whale, intragroup balances and cash pools can be represented as on-chain tokens, enabling instant internal transfers between entities, 24/7 liquidity management, real-time fund tracking and reconciliation, and privacy-preserving verification using technologies like.
Zero-knowledge proofs and homomorphic encryption. By 2024, more than a third of Ant International’s transactions were already being processed on-chain via Whale, and the platform now supports multiple tokenized assets from banks worldwide, including treasury tokens and other digital money formats. This made Ant International a natural first-mover client for a bank-led tokenized deposit service.
In May 2025, Ant International became the first client of HSBC’s new Tokenised Deposit Service (TDS) in Hong Kong. TDS is Hong Kong’s first bank-led, blockchain-based settlement service, enabling real-time, always-on HKD and USD payments between corporate wallets at HSBC Hong Kong. The service allows instant intra-group fund transfers for Ant, using Whale as the front-end treasury interface.
UBS and Swiss Banks: Tokenized Deposits on Public Blockchains
While Ant International is pushing the frontier in Asia through partnerships such as TDS, UBS is at the center of a European push to prove that tokenized bank deposits work even on public blockchains. Under the umbrella of the Swiss Bankers Association (SBA), UBS, PostFinance, and Sygnum Bank conducted a feasibility study to test tokenized deposit payments across institutions.
The pilot executed what the SBA and Reuters described as Switzerland’s first legally binding payment using bank deposits on a public blockchain. Here, the tokens represented deposit claims held at the respective banks but were transacted on the Ethereum blockchain. The legal structure ensured that each token was effectively a digital representation of a payment instruction; underlying settlement took place in conventional bank money.
This proof-of-concept showed several important things: tokenized deposits could. Move between different banks, not just inside one institution’s private system. Legal enforceability was achieved under Swiss law, and 24/7 programmable payments were possible using smart.
Contracts that could orchestrate escrow and interbank settlement logic with minimal manual intervention. Wheree Ant and HSBC focus on corporate treasury and cross-border flows, UBS’s work proves that public blockchain infrastructure can also support regulated, tokenized deposit payments between multiple banks.
Why Ant International and UBS Matter for Global Finance
So why does it matter that Ant International and UBS are both advancing. Blockchain-based tokenized deposits, even. If they are not formally. Partnered with each other? The answer is that they are complementary pioneers. At opposite ends of the financial spectrum—one rooted in. High-volume digital payments and fintech ecosystems, the other in global investment banking and capital markets. Together, their projects help establish tokenized deposits as a credible, scalable building block for the future of money.
From a corporate and institutional perspective, blockchain-based tokenized deposits address several long-standing pain points. They enable continuous, 24/7 settlement, unlocking treasury teams to move HKD, USD, or other currencies at any time, beyond traditional cut-offs. nlock programmable money, allowing smart contracts to control cash pooling, auto-sweeping, condition-based disbursements, just-in-time funding, or escrow-like settlement. They can reduce counterparty and liquidity risk by creating a shared, synchronized view of obligations across institutions, making it easier to monitor exposures and reducing the chance of disputes or delayed settlements that tie up capital.
In short, blockchain-based tokenized deposits merge the trust and regulatory clarity of traditional bank money with the efficiency of DLT-based settlement.
The practical implications go well beyond bank back offices. For large corporates, especially multinationals, tokenized deposits mean simpler global liquidity management, fewer trapped balances, lower buffer requirements, real-time FX and cash visibility, and the ability to plug treasury management systems directly into programmable payment flows. SMEs and digital-first businesses, particularly those integrated with platforms like Ant’s ecosystem, these initiatives promise faster, cheaper cross-border payments without needing to understand the underlying blockchain complexity. Fintechs and DeFi projects, regulated tokenized bank money offers a bridge between the traditional financial system and on-chain liquidity pools, opening up new product designs that combine stable, regulated value with innovative smart contract logic.
Challenges on the Road to Mainstream Adoption

Regulators are cautiously supportive but demand clarity. Tokenized deposits sit at the intersection of payments law, securities regulation, and banking supervision. Authorities must ensure that on-chain. Representations of. Deposits are. Fully backed by. And synchronized with off-chain balances.
AML/CFT rules are robust. Enforced even on. Public or semi-public blockchains and smart contracts. Failures or bugs do not compromise customer claims. Projects like the UBS-led Swiss pilot and HSBC’s TDS roll-out are therefore. Heavily structured to prove legal enforceability and regulatory compliance, not just technical feasibility.
Interoperability is another hurdle. Ant’s Whale platform already connects to multiple bank-issued tokenized assets, and UBS emphasizes a blockchain-agnostic design. UBS Tokenize, but the industry still lacks unified standards for how tokenized deposits should be. Modeled, transferred, and redeemed across diverse networks. This is where industry groups, central banks, and standards bodies—often inspired by live experiments from firms like Ant International and UBS—will play a crucial role.
On a more practical level, banks and corporates need specialized talent in blockchain engineering, cybersecurity, and smart contract auditing. They also need robust governance frameworks to manage keys, wallets, and access control for high-value tokenized money. And integration between core banking systems, DLT platforms, and treasury/ERP systems so that workflows feel seamless to end users.
Ant International’s experience with Whale, where a third or more of intra-group transactions now run on-chain. Shows that this transformation is possible but requires sustained investment over multiple years. For UBS and its peer Swiss banks, running tokenized deposit trials on public networks demands equally stringent governance. Using public infrastructure does not mean compromising on confidentiality or control. It means building the right cryptographic and operational safeguards on top.
See More: Best Cryptocurrency to Invest in 2025 Top 10 Crypto Picks for Maximum Returns
The Future of Blockchain-Based Tokenized Deposits
Looking ahead, the work of Ant International, UBS, and their banking partners points toward a future where. Blockchain-based tokenized deposits become a core part of everyday finance, not a niche experimentSeveral trends are likely to unfold. First, there will be a wider geographic rollout. HSBC has already begun expanding its tokenized deposit service beyond. Hong Kong to support cross-border transactions, and Ant International is positioning itself as a. Tech-connector for AI- and blockchain-enabled liquidity solutions across more markets. Second, deeper integration with real-world assets (RWA) will emerge.
UBS’s work on tokenized funds and tokenized securities shows how. Tokenized deposits can become part of a broader on-chain capital markets stack. Imagine a world where a corporation issues tokenized commercial paper, receives proceeds as. Tokenized deposits and settle suppliers or investors entirely on-chain. Third, the ecosystem likely to develop will feature coexistence with CBDCs and stablecoins. Rather than one model “winning,” a layered ecosystem will emerge where CBDCs support wholesale or inter-bank settlement. Tokenized deposits handle most regulated corporate and retail flows, while. Tablecoins serve as flexible, sometimes more risky, instruments in open crypto markets.