
























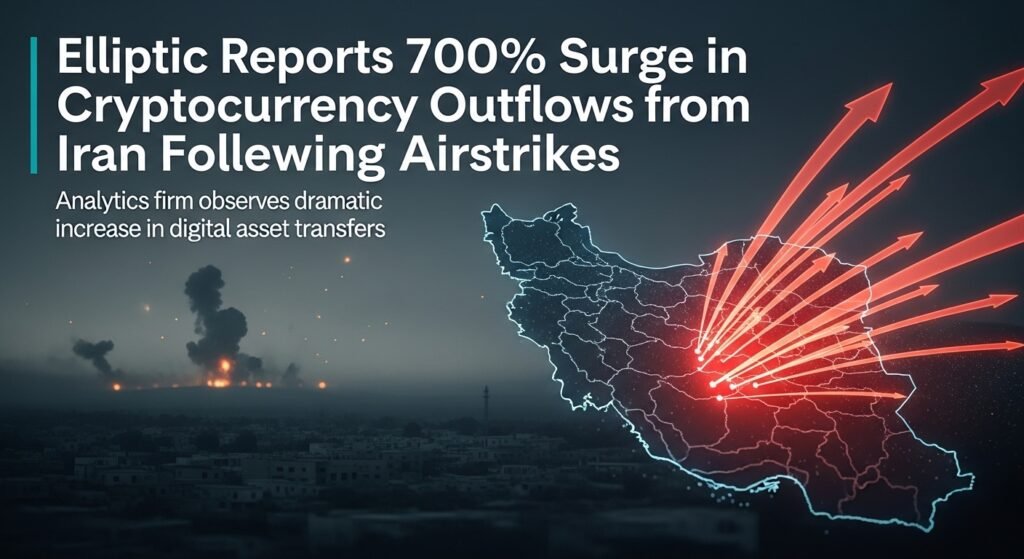
Elliptic Reports 700% Surge in Cryptocurrency Outflows from Iran Following Airstrikes

Cryptocurrency Outflows

COIN4U IN YOUR SOCIAL FEED

The global financial world once again witnesses how geopolitical crises and digital asset flows intersect, as blockchain analytics firm Elliptic revealed a staggering 700% surge in cryptocurrency outflows from Iran following recent US‑Israeli airstrikes on Tehran and other key locations. This dramatic spike, which occurred almost instantly after the first military strikes, has raised urgent questions about capital flight, financial stability, sanctions evasion, and the evolving role of cryptocurrencies in times of international strife. According to Elliptic’s on‑chain data analysis, Iran’s largest cryptocurrency exchange Nobitex experienced an unprecedented jump in outgoing transaction volume. How digital assets often serve as both a financial lifeline and a controversial tool during crises that disrupt traditional banking systems. The surge highlights broader patterns of economic behavior under duress and the complex dynamics of digital finance in regions facing intense geopolitical pressure.

Understanding the Elliptic Report and Its Immediate Context

In the wake of coordinated US and Israeli airstrikes against targets within Iran, blockchain monitoring firm Elliptic released a detailed report showing that transaction volumes leaving Iranian crypto exchange Nobitex spiked by 700% within minutes of the initial attacks. This kind of reaction illustrates how global events can instantly affect crypto markets and investor behavior, especially in jurisdictions where traditional economic channels are already constrained. Elliptic’s analysis points to substantial movement of digital assets from within Iran to offshore platforms . Users rapidly sought to preserve value or move funds beyond the reach of local controls.

Nobitex, which processed approximately $7.2 billion in crypto transactions in 2025 and serves millions of users, plays a central role in Iran’.  Its prominence means that large fluctuations in activity on the platform — such as the sudden outflows documented — can offer significant insights into how economic participants respond to political shocks and security threats. In this case, the surge in outflows signals emergency financial behaviors that extend far beyond normal market movements.

What the 700% Surge Reveals About Capital Flight and Crisis Response

The 700% surge in crypto outflows from Iran’s largest exchange isn’t merely a statistical anomaly; it reflects deeper patterns tied to how individuals and institutions seek to protect assets during crisis. When faced with heightened risk — whether from potential exchange shutdowns, fear of asset seizure, or collapsing financial infrastructure — market participants often turn to digital assets as a relatively fast and borderless means of moving value. Cryptocurrencies like Bitcoin and stablecoins provide an alternative avenue to shift funds abroad, bypassing the slower, regulated banking system.

This phenomenon is frequently referred to as capital flight, where value rapidly exits a country in response to economic instability or political upheaval. In Iran’s case, the fear of crackdown, international isolation, or further financial sanctions can drive both retail holders and larger participants to convert local currency into cryptoassets and transfer them to foreign wallets or exchanges that are perceived as safer or more accessible.

Furthermore, the speed of these transactions — with volumes jumping within minutes of airstrikes — shows how digital financial systems can react to real‑world events far more quickly than traditional mechanisms. The real‑time nature of blockchain makes it possible to observe these patterns almost instantly, giving analysts like those at Elliptic invaluable tools to monitor and understand global capital movements.

The Role of Cryptocurrencies in Sanctions and Financial Restrictions

Iran’s enduring struggle with international sanctions has made cryptocurrencies a recurring topic in discussions about financial resilience and evasion. Over the past years, digital assets have offered a way for Iranians to engage in global trade and preserve economic value despite strict limitations on cross‑border transactions and banking access. Elliptic’s report underscores this delicate balance by showing how crypto flows can accelerate sharply in times of heightened economic stress, potentially circumventing traditional banking restrictions.

While some observers view this as a natural response to financial isolation, others express concern that such movements could undermine sanctions enforcement and create avenues for illicit activity. Cryptocurrencies do not inherently distinguish legitimate financial transfers from those aimed at evading regulatory oversight, and blockchain analytics firms like Elliptic often find themselves at the center of efforts to trace and interpret these flows. Their work reveals not only the raw data of movement but also the broader implications for compliance, regulation, and international financial security.

How the Airstrikes Triggered an Immediate Crypto Market Reaction

The catalyst for this latest surge in activity was the sudden escalation of conflict following US and Israeli military actions, which created an acute sense of uncertainty throughout Iran’s financial and economic landscape. In situations where domestic banking becomes unreliable or inaccessible, digital assets often emerge as an alternative means to protect wealth or ensure liquidity. As news of the airstrikes spread and concerns over government response and economic fallout grew, Iranian crypto users began converting rials to digital assets and withdrawing them from Nobitex at an extraordinary pace.

This response also coincides with past patterns noted in Elliptic’s data, where crypto outflows spiked during earlier episodes of domestic unrest, such as widespread protests and government‑imposed internet blackouts. These patterns illustrate how geopolitical and domestic stressors can interact with financial technology, creating even greater volatility in asset flows.

Mapping Outflows: Where Are the Funds Going?
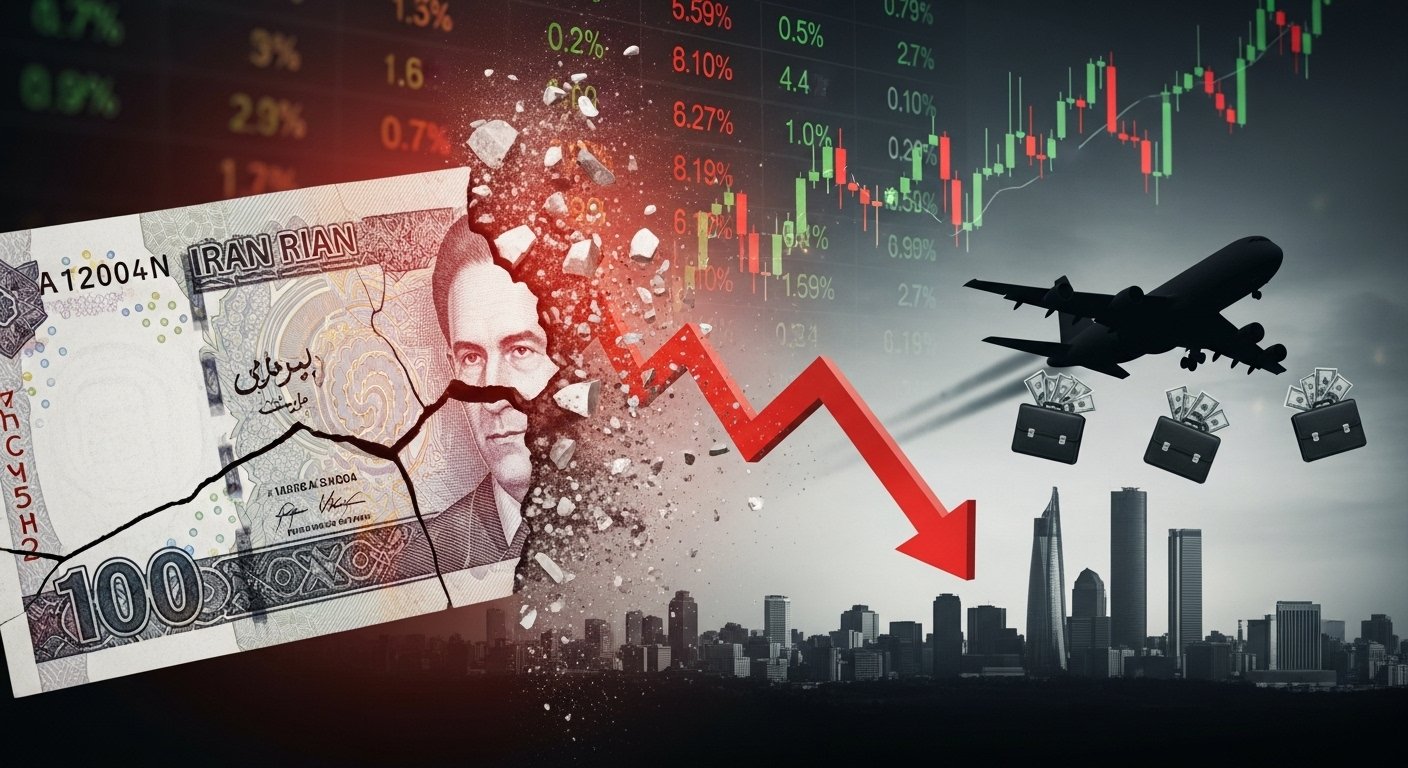
geopolitical tension.

Elliptic’s tracing work indicates that much of the outflow from Nobitex did not dissipate but was instead redirected to overseas exchanges that have historically received funds from Iranian accounts. This suggests that participants were not merely liquidating into local cash but actively seeking jurisdictions and platforms where their assets could be stored or traded in a more stable environment.

The flow of funds to foreign exchanges raises significant questions about international liquidity, regulatory compliance, and tracking mechanisms. While crypto’s transparency allows on‑chain tracing of movements, identifying the ultimate owners and intent behind transfers remains challenging, especially when assets move through multiple wallets and platforms. This creates both opportunities and complications for authorities and financial analysts striving to maintain oversight in an increasingly digital world.

Broader Implications for Iran’s Economy and the Crypto Sector

The recent outflow surge could have lasting implications for Iran’s domestic financial ecosystem and the global crypto market. If confidence in local financial infrastructure continues to erode, more users may turn to digital assets as a long‑term store of value or hedge against instability. At the same time, increased outflows can strain liquidity on local exchanges. Lead to price disparities between regional trading pairs, and create distinct market dynamics that are sensitive to geopolitical shifts.

Moreover, the international community is likely to scrutinize such movements more closely, as large‑scale transfers in times of conflict raise concerns about compliance with sanctions regimes and the potential for misuse of digital assets. Blockchain analytics firms like Elliptic will continue to play a vital role in monitoring and interpreting these trends, offering insights that help shape regulatory responses and compliance practices worldwide.

What This Means for Traders, Regulators, and Ordinary Citizens

For crypto traders, a 700% spike in outflows serves as a stark reminder of how quickly market dynamics can change in response to geopolitical tension. Volatility is often magnified in such scenarios, and traders must weigh not only traditional market signals but also broader political developments that could influence asset flows.

Regulators, on the other hand, face the ongoing challenge of balancing financial freedom with compliance, ensuring that digital asset platforms cannot be exploited for illicit finance or sanctions evasion. Elliptic’s work highlights the importance of transparent on‑chain analysis and collaborative regulatory frameworks to detect and deter suspicious movements.

For ordinary citizens in Iran, these trends reflect deeper concerns about economic stability, access to financial services, and the role of digital currencies in everyday life. When traditional banking can no longer guarantee safety or accessibility, alternative systems like blockchain technology become more than an investment — they become a vital part of economic survival.

Conclusion

The 700% surge in cryptocurrency outflows from Iran following the recent airstrikes — as reported by Elliptic — underscores the profound impact that geopolitical events can have on financial behavior, particularly within the realm of digital assets. This dramatic increase illuminates how crisis conditions catalyze rapid capital movement, demonstrating both the power and risk inherent in cryptocurrency markets. From potential capital flight and sanctions implications to the resilience of blockchain infrastructure. The situation offers a vivid example of digital finance’s evolving role in global economics and international relations. As the world watches these trends unfold, it remains clear that the intersection of geopolitics and crypto will continue to shape financial landscapes far into the future.

FAQs

Q: What exactly caused the 700% surge in cryptocurrency outflows from Iran’s Nobitex after the airstrikes?

The 700% surge in cryptocurrency outflows from Iran’s Nobitex exchange was triggered almost immediately after coordinated US and Israeli airstrikes targeted Iranian infrastructure, creating severe uncertainty about the stability of local financial systems. Blockchain analytics firm Elliptic reported that within minutes users began rapidly converting rials into cryptoassets and withdrawing them to external wallets or offshore exchanges, indicating an urgent effort to move capital out of the country and bypass traditional financial disruptions.

Q: Why would people use cryptocurrencies instead of traditional banking systems during geopolitical crises?

In times of geopolitical crisis or economic instability, cryptocurrencies offer unique advantages, including faster settlement, lower barriers to cross‑border transfers, and the ability to operate independently of centralized banking systems. In a situation where banking infrastructure might be compromised or access restricted due to sanctions, sanctions evasion . Government controls, digital assets like Bitcoin and stablecoins become a viable alternative for preserving and relocating value quickly.

Q: Does a spike in crypto outflows always indicate illegal activity or sanctions evasion?

Not necessarily. While spikes in crypto outflows can raise regulatory concerns — especially in contexts where sanctions are in place — they do not inherently prove illegal activity. Sudden increases in withdrawals can stem from a wide range of motivations, including fear of financial instability, hedge against currency devaluation. Relocation of savings, or shifts into self‑custody wallets. Blockchain analysis helps distinguish patterns, but context is crucial in interpreting intent.

Q: How do analytics firms like Elliptic trace where funds go after leaving an exchange?

Analytics firms such as Elliptic track on‑chain transaction data, which records every transfer of cryptocurrency on public blockchains. By following the path of digital assets through multiple wallet addresses and exchanges, they can identify . When funds move from local exchanges like Nobitex to foreign platforms. This tracing helps determine flow patterns, identify common destination points, and alert regulators to suspicious movements associated with sanctions or illicit finance.

Q: What might the long‑term impact of this surge be on Iran’s economy and global crypto markets?

In the long term, a 700% surge in outflows may signal ongoing capital flight and declining confidence in domestic financial infrastructure, potentially pushing more Iranian users toward decentralized finance and crypto solutions. For global markets, sustained large‑scale movements from high‑stress jurisdictions could increase volatility. Trigger regulatory scrutiny, and influence how exchanges worldwide handle compliance and monitoring of international flows. This scenario highlights the growing importance of robust blockchain analytics and international cooperation to balance financial freedom with security.


Explore more articles like this

Subscribe to the Finance Redefined newsletter

A weekly toolkit that breaks down the latest DeFi developments, offers sharp analysis, and uncovers new financial opportunities to help you make smart decisions with confidence. Delivered every Friday

By subscribing, you agree to our Terms of Services and Privacy Policy

READ MORE

Ethereum Price Prediction Calm Before a Big Move

Ethereum Price Prediction

COIN4U IN YOUR SOCIAL FEED

If you have followed crypto for more than a minute, you already know that rallies rarely move in straight lines. Trends pause, momentum cools, and sentiment flips from euphoria to anxiety, sometimes in a matter of days. That is precisely the zone Ethereum finds itself in today. After a strong advance, ETH has slipped into a corrective phase that looks unnerving on short time frames, yet constructive when you zoom out. This article delivers a thorough, human-written Ethereum price prediction that treats the pullback not as a death knell but as a potential base for a larger move. We will unpack the macro forces, on-chain metrics, technical structure, Layer-2 scaling progress, and the evolving smart contract economy that together frame the next chapters for ETH.

Corrections are where markets “exhale.” They clear out excess leverage, reset funding rates, force complacent traders to the sidelines, and let long-term investors accumulate with less noise. When you align that market rhythm with Ethereum’s underlying fundamentals—ranging from staking dynamics to rollup adoption—the case for a storm after the calm begins to take shape. None of this is financial advice, and crypto remains volatile. But if you want a data-driven narrative that connects the dots, consider the sections below your field guide to ETH’s next act.

The Structure Behind a Healthy Correction

Why Pullbacks Are a Feature, Not a Bug

Every durable uptrend needs time to digest gains. In price discovery phases, momentum tends to overshoot, RSI stretches, and spot premiums open up relative to derivatives. A measured retreat lets those indicators normalize. For ETH, an orderly drawdown accompanied by declining open interest, easing funding rates, and rising spot exchange balances can signal that hot money is leaving while patient capital re-enters. That process builds durability for the next leg higher.

A second benefit of corrections is narrative calibration. As headlines cycle from “Ethereum to the moon” to “ETH is finished,” sentiment surveys often swing to pessimism at the exact moment on-chain activity improves. Transaction throughput, gas fees, and DeFi volumes can bottom before price does, laying the groundwork for a bullish divergence. When those divergences appear alongside structural tailwinds—like the expanding Layer-2 ecosystem—they often precede powerful breakouts.

The Anatomy of ETH’s Current Range

Most corrections resolve within a range defined by a prior breakout level and a recent swing high. For Ethereum price prediction analysis, watch the zone where prior resistance turned into support after the last rally. This area tends to attract limit orders from larger players who prefer to buy weakness, not chase strength. If price consolidates above that shelf while daily moving averages curl higher, the market often stages a retest of the previous high, and then explores new territory.

A decisive break below the base would change the thesis, of course. The key is not to guess but to observe: Is volume expanding on green candles? Are liquidity pools building underneath the price? Are long/short ratios stabilizing? Taken together, those clues help refine the odds that the “calm” is actually a coiling spring.

Fundamentals: The Engine Under ETH’s Hood

Fundamentals: The Engine Under ETH’s Hood

The Supply Story After Staking and Upgrades

Since The Merge, Ethereum switched to Proof of Stake, fundamentally altering issuance and burn dynamics. With base-fee burns via EIP-1559 and a growing share of the supply staked, ETH’s liquid float can tighten during periods of high usage. When network activity rises—think NFT mints, DeFi cycles, on-chain gaming, or stablecoin flows—fee burn increases, offsetting issuance and sometimes pushing ETH toward ultrasound money behavior. For a medium-term Ethereum price prediction, a constrained effective supply is a tailwind, especially when paired with stronger demand from builders and users.

Staking adds another dimension. Staked ETH is essentially removed from liquid circulation for as long as validators choose to participate. As staking penetration grows, the proportion of ETH available to trade on exchanges shrinks. In risk-on phases, that scarcity effect can amplify upside moves; in risk-off phases, it may soften the blow by reducing forced selling. Either way, the supply curve looks friendlier to long-horizon investors than it did in the proof-of-work era.

Demand Drivers: DeFi, NFTs, and Real-World Assets

ETH is not merely a speculative token; it is the native asset of the world’s largest smart contract platform. Demand grows with utility. During calm periods, we often see developers ship at a rapid clip: new AMMs, cross-chain bridges improving security models, RWA tokenization experiments, perpetual DEXs, and lending protocols optimizing collateral efficiency. Even if volumes dip during corrections, product market fit improves in the background. Over time, a deeper bench of protocols and use cases translates into steadier base demand for blockspace, which supports fee burn and, indirectly, the ETH bid.

Real-world assets deserve special attention. As tokenized treasuries, invoices, and even property titles migrate on-chain, the network effects compound. Ethereum’s standards, tooling, and composability give it a natural advantage as the default settlement layer for programmable assets. When institutions experiment with tokenization pilots, they often pick Ethereum or EVM-compatible chains first. That funnel expands the universe of users who ultimately need ETH to interact, hedge, or provide liquidity.

Where Throughput Meets Adoption

Scaling is no longer a theoretical roadmap. Optimistic rollups and zero-knowledge rollups now process a material share of total transactions. As Layer-2 usage increases, the effective capacity of the Ethereum ecosystem grows by orders of magnitude while anchoring security back to Layer-1. That means more transactions, lower average fees on rollups, and a better user experience—without compromising decentralization. The L2 stack’s maturation, plus anticipated upgrades like danksharding and proto-danksharding (EIP-4844), is central to any credible Ethereum price prediction because it links price to real utility expansion.

Importantly, L2s don’t make ETH obsolete; they make it more necessary. Sequencers post data to Ethereum, settle disputes to Ethereum, and rely on Ethereum’s cryptoeconomic guarantees. As L2 throughput rises, the base layer remains the root of trust. The endgame resembles an internet of rollups interwoven with Ethereum as the coordinating hub. In that world, ETH’s role as the primary collateral and settlement asset strengthens, not weakens.

Technical Outlook: Levels, Structure, and Probabilities

Trend, Momentum, and the “Coil”

On multi-month charts, ETH tends to move in impulsive waves followed by consolidations shaped like flags, triangles, or rectangles. When a consolidation lasts long enough to compress volatility, the next move often travels as far as the initial impulse—or farther—depending on volume confirmation. Traders look for higher lows, shrinking realized volatility, and Bollinger Band pinches to anticipate that expansion.

In the current backdrop, a corrective channel with repeated defenses of a well-defined support area suggests accumulation. If ETH holds that structure while daily RSI resets from overbought toward neutral and MACD flattens, a push through the channel top can target the prior swing high. Above that pivot, liquidity gaps may accelerate the price toward psychological round numbers. If the base fails, the next confluence zone—often near a rising 200-day moving average or a Fib retracement cluster—becomes the line in the sand for invalidation.

Market Internals to Watch

During this “calm,” monitor three internal gauges. First, derivatives positioning: declining open interest after a downside wick hints at liquidation events that clean the runway. Second, spot CVD (cumulative volume delta) on major exchanges: persistent spot buying against fading sell pressure often precedes breakouts. Third, stablecoin inflows.

When fresh stablecoin liquidity enters exchanges, it can foreshadow bid strength across majors, including ETH.If those internals turn in tandem while price remains within the consolidation, the probability of an upside resolution rises. Combine that with improving on-chain activity—like higher daily active addresses on L2s—and the bullish Ethereum price prediction gains credibility.

Macro Backdrop: Liquidity, Policy, and Risk Appetite

Macro Backdrop: Liquidity, Policy, and Risk Appetite

The Dollar, Rates, and Crypto Beta

Crypto does not trade in a vacuum. A softer U.S. dollar, steady or declining real yields, and easing financial conditions tend to support risk assets. When macro risk appetite improves, capital flows to growth stories—and Ethereum’s scaling arc is one of the strongest in the digital asset space. Conversely, spikes in volatility indexes or hawkish policy surprises can sap momentum. For ETH, the base case is that macro acts as a tailwind when it stabilizes rather than as a primary driver. The structural catalysts inside Ethereum often matter more over a 6–18 month horizon.

Regulatory Clarity and Institutional On-Ramps

Regulatory milestones remain a wild card but trend toward clarity. Each incremental approval for compliant crypto custody, broker-dealer frameworks, or ETF-like vehicles (where applicable) reduces friction for institutions. Whether through direct acquisition of ETH, staking-as-a-service, or exposure to EVM ecosystems, easier on-ramps expand the buyer universe. The market may not reprice that in a single session; instead, it seeps into valuations as allocators grow comfortable. For our Ethereum price prediction, this slow normalization acts like a rising tide under the surface.

On-Chain Signals: What the Data Whisper

Active Addresses, Fees, and Burn

A strong mid-cycle base often starts with subtle improvements in on-chain throughput. Look for a gentle rise in active addresses, stabilization in median fees on L2s, and upticks in fee burn during usage spikes. Because EIP-1559 ties fees to burn, a resurgence in activity mechanically reduces net issuance, tightening supply. If that burn coincides with calmer markets and increasing staking deposits, the float available for trading narrows—exactly the setup that can turn a correction into a springboard.

Exchange Balances and Long-Term Holders

Two more tells: declining exchange balances and unwavering long-term holder supply. When coins move from exchanges to self-custody, they are less likely to be market-sold on impulse. A plateau or drop in exchange reserves during a price dip often signals accumulation. Meanwhile, coins dormant for 6–12 months typically belong to holders with high conviction. The stickiness of that cohort can dampen drawdowns and amplify rebounds, especially when new entrants arrive via Layer-2 apps and need ETH to interact.

The Narrative Flywheel: Builders, Users, and Capital

Composability and the App Layer

Ethereum’s most underestimated advantage is composability. Protocols can be stacked like LEGO bricks—a lending market feeding a DEX, which feeds a derivatives venue, which feeds a yield optimizer. The result is a dense economy where innovations don’t live in silos. Each new primitive increases surface area for other builders, accelerating iteration. Even if token prices rest, the app layer keeps moving. When markets wake up, they find a richer ecosystem than before, which helps explain why ETH rallies can travel farther than skeptics expect.

The Consumer Experience

User experience used to be Ethereum’s Achilles’ heel. Gas fees were unpredictable, and transactions could lag during peak times. That is changing fast on rollups, where transactions settle in seconds at a fraction of the cost while inheriting Ethereum’s security guarantees. Wallets are adopting account abstraction, session keys, and smart wallets that enable seamless interactions. As the UX gap closes, the total addressable market expands—from crypto-natives to mainstream users. A better UX translates into more transactions, deeper liquidity, and more fees—key ingredients in any sustainable Ethereum price prediction.

See More: Ethereum Price Prediction: ETH May Beat Bitcoin in October

Scenario Analysis: Paths Out of the Calm

Bullish Continuation

In the bullish path, ETH continues to consolidate above prior resistance turned support, with volatility compressing and market internals turning constructive. A breakout above the range high triggers a quick move to retest the previous swing peak. If volume expands and derivatives remain disciplined, ETH explores new highs for the cycle. Catalysts include L2 transaction records, notable RWA tokenization launches, and improved DeFi TVL quality. The measured move target from the consolidation width adds to confidence, and a weekly close above that target invites a trend extension.

Constructive Chop, Then Lift-Off

In a neutral-to-constructive path, ETH spends longer in sideways chop, mirroring a macro environment that is neither overtly risk-on nor risk-off. On-chain trends grind higher, builders keep shipping, and the market “bores” participants into disbelief. Eventually, a catalyst—perhaps a major enterprise tokenization pilot or a high-profile consumer app on L2—kicks demand into a higher gear. Structural supply constraints do the rest. The rally begins when few expect it, lending it staying power.

Bearish Breakdown and Reset

In the bearish path, support fails on a decisive weekly close with heavy volume and rising exchange inflows. ETH revisits a deeper retracement cluster around long-term moving averages. While difficult emotionally, such resets often improve forward returns by flushing weak hands and creating attractive risk-reward zones for patient buyers. The invalidation for a bullish Ethereum price prediction would be a sustained breakdown below the range and a trend of lower highs and lower lows on weekly time frames, especially if accompanied by deteriorating on-chain usage.

Risk Management: How to Think, Not What to Buy

Time Horizons and Position Sizing

No price prediction is complete without a reminder about horizons and sizing. Short-term traders compete in a noisy arena; daily candles can flip the narrative in hours. Long-term investors, by contrast, focus on adoption curves, supply dynamics, and developer momentum. For the former, tight stop-loss rules and clearly defined invalidation levels are essential. For the latter, dollar-cost averaging through corrections and rebalancing near strength can smooth outcomes. Align approach to temperament; the market rewards consistency more than heroics.

Catalysts That Could Surprise

Surprises cut both ways. Positive shocks might include faster-than-expected danksharding milestones, regulatory clarity around staking services, or a flagship consumer application onboarding millions via Layer-2. Negative shocks could involve smart contract exploits, macro liquidity crunches, or policy changes that unsettle the risk landscape. Build a plan that acknowledges both tails, and remember that the most explosive moves often follow periods of deceptive calm—exactly where ETH may be resting now.

Why the Calm Can Precede the Storm

Corrections cleanse. They neutralize froth, calm indicators, and refocus the market on fundamentals. For Ethereum, those fundamentals—Proof of Stake, EIP-1559 burn, rising staking shares, expanding Layer-2 throughput, and a relentless builder culture—sketch a credible path to higher valuations over the medium term. Technicals support the case with a coiling consolidation, while on-chain signals hint at patient accumulation. Macros, for their part, are likely to amplify rather than define the next act. It is not hard to envision a scenario where the current calm gives way to a decisive break, catching underexposed participants flat-footed.

The operative word is “if.” If support holds, if internals improve, if utility expands, then the probability skew favors the bulls. The best Ethereum price prediction is not a single number, but a framework. Within that framework, today’s correction looks less like an ending and more like the quiet breath before a storm.

Conclusion

Ethereum’s pullback is tempting traders to overreact, but the deeper picture argues for patience. Supply dynamics look structurally supportive after the shift to Proof of Stake and ongoing fee burn. Demand has durable drivers in DeFi, NFTs, RWA tokenization, and the maturing Layer-2 ecosystem. Technicals resemble a classic volatility coil above prior resistance, while on-chain indicators and market internals hint at accumulation.

Macro conditions will sway the tempo, yet fundamental adoption is the underlying beat. No forecast is guaranteed, and risk management is non-negotiable. But if you connect the dots, the correction appears less like weakness and more like a foundation. In that light, the calm could indeed be the preface to a storm.

FAQs

Q: Is Ethereum’s correction a sign of a trend reversal?

A correction by itself does not signal a trend reversal. Healthy markets breathe in and out. If ETH holds above key support zones, shows higher lows on daily charts, and market internals like funding and open interest normalize, the odds favor a continuation rather than a breakdown. A weekly close below the base with heavy volume would challenge that thesis and force a reassessment.

Q: How do Layer-2 rollups affect Ethereum’s price outlook?

Layer-2 rollups expand throughput and cut costs while anchoring to Ethereum’s security. As more activity migrates to L2s, the ecosystem processes more transactions, improving user experience and broadening adoption. Because ETH remains the settlement and collateral asset, increased L2 activity ultimately supports demand for ETH and strengthens long-term price dynamics.

Q: What on-chain metrics should I watch during a consolidation?

Focus on active addresses, fee burn trends, exchange balances, and staking participation. Rising activity with stable or falling exchange reserves often signals accumulation. Also track derivatives metrics like open interest and funding rates; a reset there can clear the runway for the next leg higher.

Q: Could regulation derail the bullish case for Ethereum?

Regulatory shocks can inject volatility, but the long-term trajectory has been toward greater clarity. Clearer rules for custody, disclosures, and market structure typically expand institutional participation. While policy setbacks are possible, gradual normalization often increases the pool of buyers and deepens liquidity over time.

Q: What is a prudent strategy during the “calm” phase?

Align strategy with time horizon. Short-term traders can define invalidation levels within the range and avoid over-leveraging. Long-term participants might dollar-cost average on weakness, diversify across catalysts, and maintain dry powder for opportunities. In all cases, risk management and patience matter more than perfect entries.

Explore more articles like this

Subscribe to the Finance Redefined newsletter

A weekly toolkit that breaks down the latest DeFi developments, offers sharp analysis, and uncovers new financial opportunities to help you make smart decisions with confidence. Delivered every Friday

By subscribing, you agree to our Terms of Services and Privacy Policy

READ MORE

ADD PLACEHOLDER