If you trade often, fees compound like friction. A tenth of a percent here, a network surcharge there, and suddenly your “edge” is gone. This October 2025 review zeroes in on the crypto exchanges with the lowest fees, comparing maker-taker fees, spot trading fees, derivatives fees, withdrawal fees, and the fine print that quietly moves the goalposts. We also look at typical VIP tiers, volume discounts, and token-based fee reductions so you can match the right platform to your size and style.
To keep this practical, each exchange summary covers baseline spot pricing for entry-level accounts, what it takes to lower that rate, and what traders actually feel in real use. Because promotions change, we cite each exchange’s current fee schedule or most up-to-date help page so you can verify before you switch.
Along the way, we weave in related concepts—maker-taker fees, zero-fee trading, KYC tiers, liquidity, margin and futures fees, and stablecoin pairs—so the analysis stays grounded without becoming a jargon soup. The result is a natural, readable guide that helps you minimize trading costs without sacrificing reliability, tools, or asset coverage.
How “low fees” really work
Before we rank the cheapest options, remember that “low fees” are not a single number. Exchanges typically quote base maker and taker percentages for spot trading. Makers add liquidity with resting limit orders; takers remove it with marketable orders. Most platforms then stack volume-based VIP tiers and token discounts. Some add pair-specific promos (for example, stablecoin pairs) and temporary zero-fee campaigns. Finally, there are non-trading costs—from fiat deposit/withdrawal charges to crypto network fees—that materially change what you pay.
In short, the best exchange for you depends on whether you place limit orders, your 30-day volume, whether you’re comfortable holding an exchange token for discounts, and which assets/networks you withdraw most often.
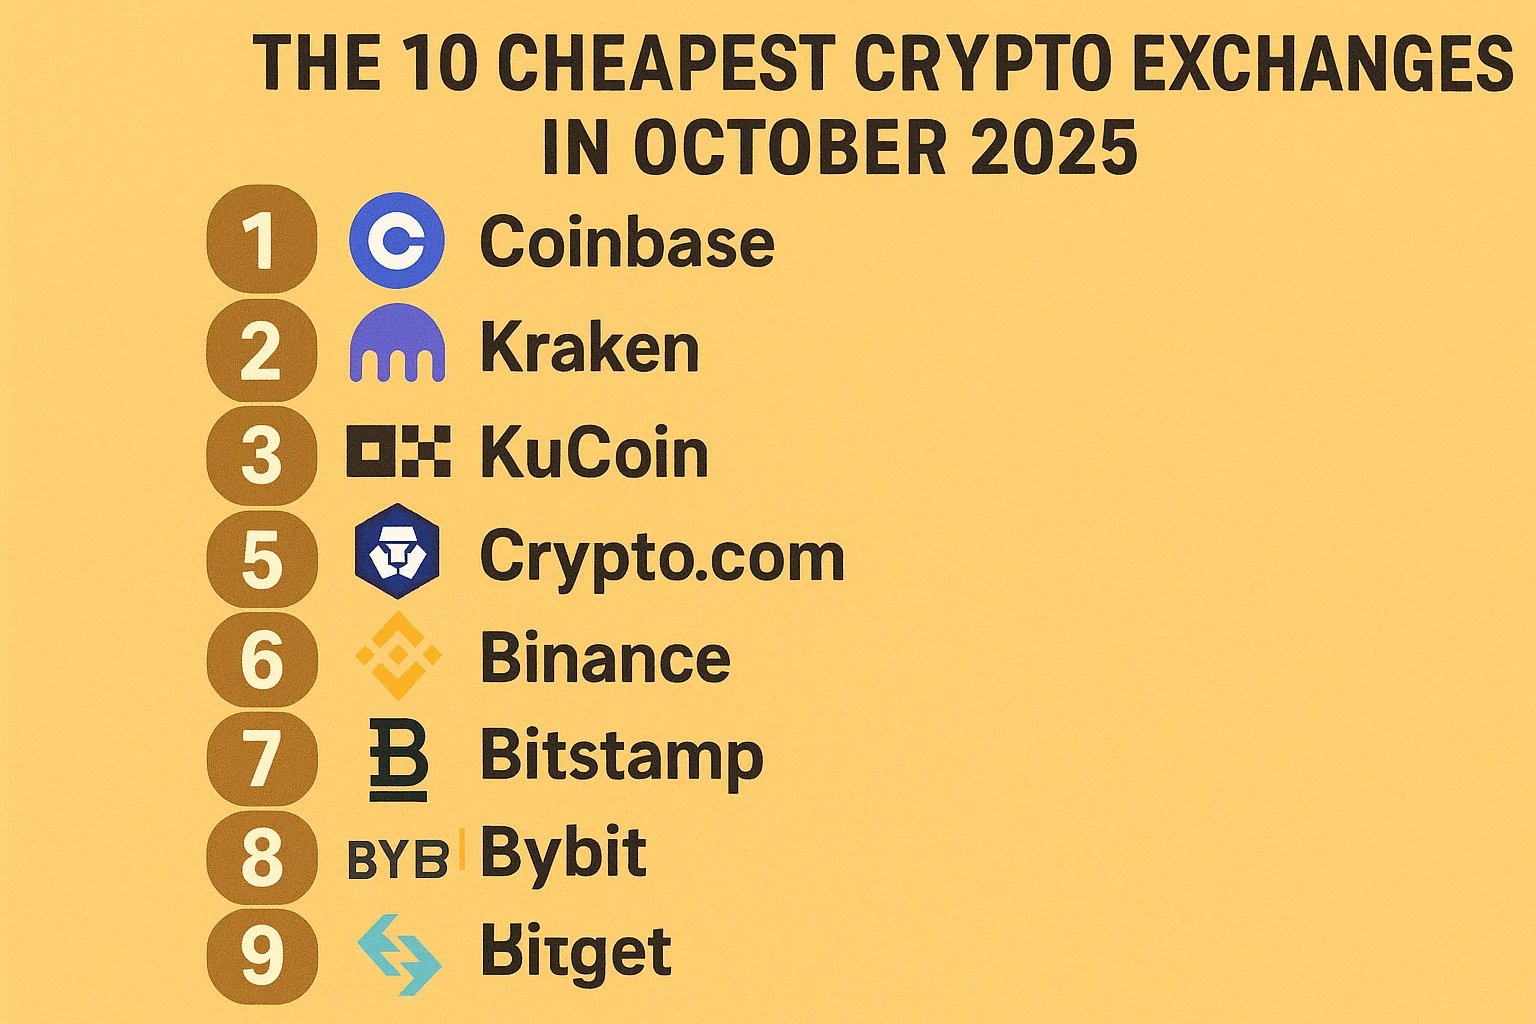
The 10 cheapest crypto exchanges in October 2025
Binance
For years, Binance has set the pricing anchor. The baseline spot maker/taker is typically around the 0.10% mark with additional rebates through BNB fee payment and volume tiers. The live fee schedule is public and updated as tiers and promos change, so confirm current spot percentages and discounts there.
Why it’s cheap in practice: aggressive VIP tiering can cut fees sharply for active traders, and paying with BNB reduces them further on eligible pairs. Occasional zero-fee pair campaigns on large stablecoin pairs have historically pushed realized costs down even more. Third-party comparisons as of late September 2025 still find Binance’s structure among the most competitive globally, especially for higher-volume accounts.
Bybit
Bybit’s spot fees are in the same bargain band, and the company recently refreshed its structure for higher-tier derivatives traders, which speaks to a platform in active price competition. The public help page shows maker/taker spot tiers and VIP pathways, with example spot taker and maker rates dropping as your 30-day volume climbs. Pro-level/market-maker derivatives pricing was regrouped this summer to favor liquid pairs.
Independent fee roundups in September 2025 likewise put Bybit near the front of the pack for both spot and perpetuals, especially if you qualify for discounted tiers.
OKX
OKX posts public regular vs. VIP fee tables and, crucially for new users, the regular user starting point for spot is in the 0.08% maker / 0.10% taker neighborhood, with deeper cuts via OKB token discounts and volume. This makes OKX one of the lowest starting points for spot among big-liquidity exchanges.
Note that earlier in 2025, the operator of OKX entered a U.S. plea agreement over legacy compliance gaps and is under an external consultant through 2027. This does not change posted fees, but U.S. readers should be aware of the history and ongoing remediation.
Kraken
Kraken’s spot structure starts higher than the ultra-low platforms, but remains very competitive on Kraken Pro, with volume-based maker-taker discounts and specialized pricing for stablecoin/FX pairs. The official fee schedule details the tiers; third-party updates (September 2025) corroborate the maker-taker model and note that Instant Buy volumes don’t count toward Pro discounts. If you trade on the Pro interface and place resting orders, your effective fees can fall quickly with volume.
KuCoin
KuCoin’s baseline spot pricing is extremely sharp. Recent comparisons peg its entry spot fees around 0.10% maker / 0.12% taker, with KCS token payment reducing costs and VIP tiers cutting them further. That slots KuCoin among the lowest-cost large exchanges for casual and semi-active users. Always confirm specifics on KuCoin’s current fee and VIP grid, as occasional pair reclassifications and token-based adjustments can tweak the calculus.
Bitget
Bitget’s spot structure is simple and cheap at a 0.10% / 0.10% base for maker and taker, with a 20% discount when you pay fees in BGB. Its support center documents the current schedule, and an explanatory article outlines the BGB reduction and futures maker/taker levels (0.02% / 0.06% baseline), keeping Bitget firmly in the low-fee conversation for both spot and derivatives.
MEXC
MEXC competes aggressively on price and frequently touts zero maker spot fees and low taker rates on many pairs. Its public fee page and recent explainer emphasize maker-zero policies and MX token discounts, which can push effective spot costs toward the bottom of the industry range for limit-order traders. As always, verify which pairs and geographies are eligible at the moment you trade.
Gate.io
Gate.io’s fees vary by volume tier and occasional promos; the platform provides a detailed help article on how spot fees are calculated and maintains up-to-date outlines of the tier structure. Some quarterly promos, such as temporary zero withdrawal fees on specific stablecoins earlier in 2025, don’t affect trading fees but do reduce non-trading costs that many users feel every month. For pure spot maker/taker, consult the live tables or a current review to benchmark against competitors.
Bitstamp
After its June 2025 acquisition by Robinhood, Bitstamp refreshed public materials while retaining its tiered maker-taker model. Official pages and updated third-party summaries show that entry-level fees are not the absolute lowest versus Asia-based rivals, but pro-tier pricing can be attractive for higher volumes with solid fiat rails and a long-standing regulatory footprint. If you value fiat on/off-ramp convenience and a simpler experience, Bitstamp’s effective cost can be competitive when you factor in fewer external fees.
Phemex
Phemex documents VIP and non-VIP spot tiers publicly and remains price-competitive for spot and derivatives. Several 2025 reviews and the official help center note 0.10% / 0.10% as a standard spot baseline, with deeper discounts at higher tiers and occasional maker-zero opportunities for top-tier users. If you alternate between perps and spot, Phemex is a tidy, low-friction option with transparent pricing. phemex.com+2Blockchain
Which are truly the “lowest fee” right now?
If you only place limit orders on spot, the platforms with maker-zero policies on many pairs—MEXC and some VIP tiers at Phemex—can deliver the lowest effective fees for pure liquidity provision, assuming your orders actually rest and fill rather than crossing the spread. OKX also starts regular users at 0.08% maker, beating most big exchanges out of the gate, and Binance, Bybit, KuCoin, and Bitget cluster at ~0.10% before discounts. Kraken Pro and Bitstamp trend a touch higher on starting tiers, but catch up fast with volume and offer highly regarded fiat rails and compliance. For a U.S. resident concerned with jurisdiction, Kraken and Coinbase Advanced are familiar, though Coinbase’s posted Advanced spot tiers typically start higher than global rivals. Always check the live table for your exact 30-day volume.
Beyond percentages: the hidden fee traps
Token discounts and volatility
Token-based fee reductions are a double-edged sword. Paying with BNB, KCS, BGB, OKB, or MX can lop 10–25% off trading fees, but the token price risk can outweigh the savings if you hold a large balance just to unlock the discount. Independent comparisons caution users to compute expected savings versus the volatility of the token used for discounts.
Maker vs. taker execution reality
Posting a limit order does not guarantee maker status. If your order crosses the spread immediately, you’ll pay the taker fee. On fast moves, partial fills can switch between maker/taker, creating an effective blended rate above your plan. Exchanges like Kraken explicitly classify this on their fee pages, and most exchanges document the rule similarly. Crypto Exchanges with Lowest Fees.
Network and fiat rails
Even with zero-fee trading, you still pay network fees to withdraw crypto and bank/wire fees for fiat. Some platforms run temporary withdrawal promotions or offer cheaper networks (e.g., BEP-20) that can cut costs. Gate.io, for example, previously offered zero withdrawal fees on select stablecoins for a limited window in early 2025. Always check the asset-network combo before you move funds.
Deep dives: who suits which trader?
Low-frequency spot buyer
If you buy once a month and hold, the difference between 0.10% and 0.16% might be less important than asset selection, fiat on-ramps, and custody practices. Kraken and Bitstamp stand out for regulated fiat rails and security history; Binance, OKX, Bybit, and KuCoin provide wider coin coverage and aggressive pricing if you scale up. Crypto Exchanges with Lowest Fees.
Active spot scalper
If you place many limit orders and care about maker rebates or maker-zero tiers, MEXC and Phemex can be cost leaders, with OKX an excellent all-rounder at 0.08% maker for regular users. Bitget is also highly predictable at 0.10% / 0.10% and easy to discount via BGB.
Perpetuals and futures trader
Perp traders should look beyond spot fees. Bybit and Bitget document competitive futures tiers (e.g., ~0.02% maker / 0.05–0.06% taker starting points), while Phemex and OKX sit in the same bandwidth with nuanced VIP ladders. Check the exact contract type (coin-margined vs. USDT/USDC margined) as rates can differ.
U.S.-centric trader
If you need a U.S.-regulated venue, Kraken Pro and Coinbase Advanced are the usual picks. Kraken’s Pro tiers can be far cheaper than Coinbase Advanced’s entry tier, which commonly starts higher for makers and especially takers; confirm the current Coinbase Advanced table before you trade.Crypto Exchanges with Lowest Fees.
Exchange-by-exchange snapshots (October 2025)
Binance: broad discounts and deep liquidity
Binance’s 0.10% base spot fees, BNB discounts, and rotating pair promos keep realized costs low for many traders. The fee schedule page is the canonical reference and should be checked for your VIP tier and any zero-fee pairs currently active. If you already trade high volume, Binance’s upper VIPs remain among the cheapest globally. Crypto Exchanges with Lowest Fees.
Bybit: sleek interface, consistently low pricing
Bybit’s help center lists maker/taker spot tiers and a straightforward VIP pathway. The August 2025 derivatives update bundled contract groups for more competitive pricing, which is relevant if you primarily trade perps and options. For spot, expect numbers in the 0.10% band at the entry level with reductions through VIP and occasional promotions.
OKX: lowest regular maker, flexible VIP
OKX’s public fee page shows its regular user spot maker rate starting at 0.08%, with 0.10% taker, undercutting most large exchanges for new accounts. OKB holdings and volume move you down the grid quickly. Liquidity on majors is excellent; for long-tail tokens, always compare spreads before assuming “cheap fees” equals “cheapest fills.” Crypto Exchanges with Lowest Fees.
Kraken: Pro tiers and strong fiat rails
Kraken’s Pro fee schedule uses a familiar maker-taker ladder. If you’re coming from standard “Instant Buy,” you’ll see major savings by switching interfaces. Volume pushes you toward much lower effective rates, and the platform’s stablecoin/FX pricing can be especially sharp.
KuCoin: token discounts and deep alt coverage
KuCoin’s entry spot fees—~0.10% maker / 0.12% taker—plus KCS discounts come in well under industry averages, according to September 2025 comparisons. With a big roster of altcoins, KuCoin is a cost-effective venue if you handle stablecoin routing and consider withdrawal networks to keep non-trading costs low. Crypto Exchanges with Lowest Fees.
Bitget: simple, cheap, and derivatives-friendly
Bitget’s 0.10%/0.10% spot baseline, optional BGB 20% fee payment discount, and 0.02%/0.06% futures starting tier give you predictable math. If you value an uncluttered fee story without hunting promos, Bitget is easy to model.
MEXC: maker-zero on many pairs
MEXC highlights 0% maker and low taker spot fees on numerous markets, plus MX token deductions. If your strategy is post-only, MEXC can drive your effective fee nearly to zero. Double-check eligible markets and your region’s access.
Gate.io: competitive tiers and helpful promos
Gate.io’s fee calculation guide walks through the math, and the platform occasionally layers withdrawal promos that, while separate from trading, reduce your total cost of ownership. For strict spot fee comparisons, use the live tier table or a fresh 2025 review.
Bitstamp: regulated rails, improving tiers
Bitstamp maintains a clear maker-taker table and, post-acquisition by Robinhood (June 2025), remains focused on compliance and fiat access. Entry-level fees aren’t always the lowest, but high-volume tiers and reliable banking make it a good value for traditional finance users moving size.
Phemex: low baseline with VIP headroom
Phemex’s official help page and mid-2025 reviews place spot at 0.10%/0.10% baseline, with VIP levels knocking those figures down, and sometimes to make zero at the top. If you split time between spot and perps, Phemex’s grid is easy to plan around.
Practical ways to pay less—without changing your strategy
Use post-only and good-til-canceled (GTC) orders
If your exchange charges maker-zero or reduced maker rates, using post-only helps you avoid accidental taker fills in fast markets. On platforms like MEXC (often 0% maker on many pairs) and OKX (low maker baseline), this small toggle meaningfully lowers effective costs over a month.
Pick the right network for withdrawals.
When you move stablecoins or ETH, the network matters as much as the exchange. A BEP-20 withdrawal can be a fraction of the cost of an ERC-20 one. Watch for temporary promos like Gate.io’s past zero-fee stablecoin withdrawals on specific networks; those savings stack with your trading discounts.
Don’t over-optimize with volatile fee tokens.
Exchange tokens can slash fees but add portfolio risk. Independent reviews flag this trade-off; if your account balance is small, a token drawdown can erase a year of fee savings. Consider paying with the token only in small, rolling amounts—enough for fees, not as a core holding. Crypto Exchanges with Lowest Fees.
See More: Best Cryptocurrency Exchange for Beginners 2025 Complete Guide
Methodology and what to check before you switch
We prioritized public fee schedules and exchange help pages updated in 2025, and cross-checked against recent third-party comparisons to confirm practical, user-observed costs. Because campaigns change, always:
-
Confirm the current maker/taker table and your VIP tier on the exchange’s official fee page.
-
Check the eligible networks and withdrawal fees for your top assets.
-
If you are U.S.-based or travel, verify geo restrictions and compliance notes that may affect your account.
Conclusion
The cheapest exchange for you is the one whose fee grid aligns with your order style, volume, and cash-flow habits. If you mostly place limit orders, MEXC, Phemex (VIP), and OKX can drive maker costs to the floor. If you want big-brand liquidity and deep markets with predictable savings, Binance, Bybit, KuCoin, and Bitget hit the sweet spot, especially when you layer token discounts and VIP tiers.U.S.-centric or prioritize regulated fiat rails, Kraken Pro and Bitstamp often deliver the best total cost once you factor in funding and withdrawals.
Whatever you choose, keep a simple checklist: confirm today’s fee table, enable post-only for maker pricing, route withdrawals on cheaper networks, and avoid over-allocating to fee tokens. Do that, and your effective trading fees should fall—quietly but materially—every month.
FAQs
Q: What’s the difference between maker and taker fees, and why does it matter?
Maker fees apply when your order adds liquidity to the book; taker fees apply when your order executes immediately and removes liquidity. On exchanges that set maker lower than taker—or maker zero—a post-only limit strategy can significantly reduce costs. Check each exchange’s definition on its fee page; Kraken’s explanation is representative of how the model works. Crypto Exchanges with Lowest Fees.
Q: Which exchange has the absolute lowest spot fees right now?
At the entry tier, OKX posts 0.08% maker / 0.10% taker for regular users, which is among the lowest published baselines on major venues. MEXC frequently offers 0% maker and low taker on many spot pairs, which can be even cheaper for post-only traders. Verify pair eligibility and your region before relying on a headline rate.
Q: Are token-based discounts (BNB, KCS, OKB, BGB, MX) worth it?
They can be, but remember the price risk of holding volatile assets purely to cut fees. Third-party fee reviews advise calculating expected savings against token volatility; a 15–25% discount can be wiped out by a bad week in the token price. A balanced approach is to keep a small buffer just for fee payment, not a strategic position.
Q: I’m in the U.S. Which low-fee options make sense?
Kraken Pro is a strong low-fee candidate with transparent tiers. Coinbase Advanced is convenient but typically starts higher on maker and taker rates—check the live table before assuming cost parity with global exchanges. Also consider venue history and current compliance updates when making a decision.
Q: Do withdrawal promotions actually matter if I trade a lot?
Yes. If you move funds frequently, network and withdrawal fees can rival trading fees. Temporary promos—like Gate.io’s early-2025 zero-fee stablecoin withdrawals on certain networks—meaningfully lower total costs even if your spot fee is already low. Always compare networks and watch for time-boxed promotions.