


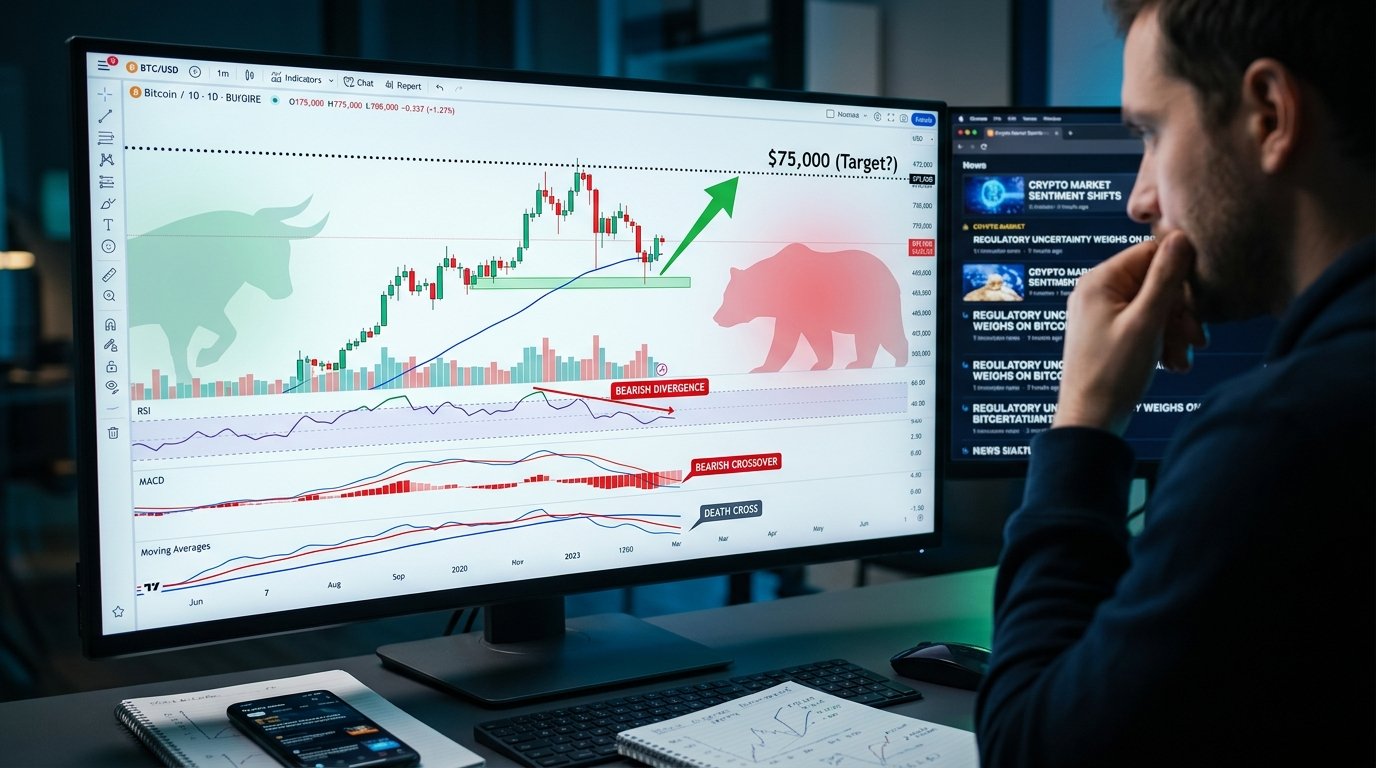
The Bitcoin price has once again entered a critical phase as traders and analysts closely monitor shifting momentum across major technical indicators. After months of volatile trading, the market is now debating whether Bitcoin is heading toward a deeper correction or simply undergoing a healthy pullback before the next bullish expansion. The discussion has intensified due to a weakening RSI (Relative Strength Index) and a potential SMA (Simple Moving Average) crossover, both of which are traditionally viewed as early warning signals of bearish momentum.
At the center of this debate is the psychological and technical level around $75,000, which many analysts are now identifying as a possible downside target if selling pressure accelerates. The Bitcoin price trend is being influenced not only by technical charts but also by broader macroeconomic conditions, liquidity shifts, and investor sentiment across both retail and institutional markets.
Understanding whether Bitcoin is genuinely at risk of falling toward $75K or simply consolidating requires a deep dive into technical structure, market psychology, and on-chain behavior. This article breaks down these elements in detail to help investors interpret what may come next for the Bitcoin price action.
Current Bitcoin Price Structure and Market Context
The current Bitcoin price structure shows a market transitioning from strong bullish momentum into a more cautious and uncertain phase. After significant upward moves earlier in the cycle, BTC has begun to show signs of exhaustion as buyers lose short-term control and sellers gradually increase pressure.
From a structural perspective, Bitcoin is still trading within a broader macro uptrend. However, short-term charts suggest weakening momentum, especially as price fails to consistently hold above key resistance zones. This divergence between long-term bullish structure and short-term bearish signals is what makes the current market environment particularly complex.
The crypto market sentiment has also shifted from extreme optimism to a more neutral-to-bearish tone. Traders are increasingly focusing on risk management, especially as volatility rises and liquidity conditions tighten. Historically, such phases often precede either a strong breakout continuation or a corrective move toward deeper support levels.
SMA Crossover Explained and Its Impact on Bitcoin Price
One of the most closely watched signals in the current Bitcoin price analysis is the potential SMA crossover, particularly between the short-term and long-term moving averages. A bearish crossover typically occurs when a shorter-term SMA drops below a longer-term SMA, signaling weakening momentum.
In previous market cycles, such crossovers have often preceded extended consolidation phases or deeper corrections. However, they are not always precise timing tools. Instead, they are better understood as trend confirmation indicators that reflect broader market sentiment shifts.
For Bitcoin, a bearish SMA crossover suggests that recent buying pressure is no longer strong enough to sustain upward momentum. If confirmed, this could reinforce downside targets such as the $75K level, especially if accompanied by increasing selling volume.
RSI Bearish Momentum and Market Psychology
The RSI indicator is another key factor influencing the current Bitcoin price outlook. RSI measures momentum and helps identify whether an asset is overbought or oversold. In the current setup, RSI is trending downward from previously elevated levels, signaling weakening bullish strength.
A declining RSI does not necessarily mean immediate price collapse. However, it does indicate that buyers are losing control of short-term momentum. When RSI enters bearish territory below the neutral 50 level, it often reflects increased probability of further downside or consolidation.
In the context of Bitcoin, a weakening RSI combined with a potential SMA crossover creates a confluence of bearish technical signals. This is why analysts are increasingly discussing the possibility of a retracement toward lower support zones, including the widely watched $75K region.
Why $75K is Being Discussed as a Key Bitcoin Price Target
The $75,000 level has emerged as a significant psychological and technical zone in recent Bitcoin price predictions. Traders often identify such round-number levels as potential liquidity zones where large buy orders may be clustered.
From a technical standpoint, $75K aligns with previous consolidation areas and potential retracement levels based on Fibonacci structures and historical price behavior. If Bitcoin fails to maintain support above current levels, the market could naturally gravitate toward this zone.
Additionally, market psychology plays a major role. Large corrections in crypto assets often overshoot key support levels before stabilizing. As a result, traders are preparing for scenarios where Bitcoin briefly dips into lower liquidity zones before recovering.
Support and Resistance Levels in the Bitcoin Price Chart
The Bitcoin price chart analysis highlights several important support and resistance zones that are shaping current market behavior. Resistance has formed near recent highs, where selling pressure has repeatedly increased. On the downside, intermediate support levels are being tested more frequently.
If these supports fail to hold, momentum-based selling could accelerate, pushing Bitcoin toward deeper correction levels. This is where the $75K zone becomes relevant as a potential structural support area.
At the same time, if Bitcoin manages to reclaim resistance levels with strong volume, the bearish outlook could quickly weaken, leading to renewed bullish momentum. This dual possibility reflects the highly reactive nature of current market conditions.
Liquidity Zones and Market Behavior
Liquidity is a critical driver of short-term Bitcoin price movements. Large market participants often target areas where stop-loss orders and leverage positions are concentrated.
The $75K level is increasingly viewed as a potential liquidity magnet. If downward pressure intensifies, price may move toward this zone to capture resting liquidity before reversing.
Understanding liquidity dynamics helps explain why markets often move beyond expected technical levels before stabilizing. This behavior is especially common in crypto trading environments, where leverage is widely used.
Technical Indicators in Detail
A deeper analysis of the Bitcoin price trend requires combining multiple technical indicators rather than relying on a single signal.
SMA Crossover Implications for Bitcoin Price
The SMA crossover signal reflects a shift in trend momentum. When short-term averages fall below long-term averages, it indicates that recent price action is weaker than historical trends.
For Bitcoin, this often suggests a transition from bullish expansion to consolidation or correction. However, false signals can occur during high-volatility periods, making confirmation through volume and price structure essential.
RSI Breakdown and Momentum Weakness
The RSI breakdown reinforces the idea that bullish momentum is fading. As RSI continues to trend lower, it suggests that buying strength is insufficient to push Bitcoin into new highs without consolidation.
When RSI aligns with bearish SMA signals, the probability of downside continuation increases. This combination is why traders are closely watching whether Bitcoin can stabilize or continue its corrective phase.
On-Chain and Macro Factors Influencing Bitcoin Price
Beyond technical indicators, the Bitcoin price outlook is heavily influenced by broader macroeconomic and on-chain factors.
Institutional participation, especially through ETFs and regulated investment vehicles, plays a major role in shaping liquidity flows. Periods of reduced inflows often coincide with price stagnation or correction phases.
Macroeconomic conditions such as interest rates, inflation expectations, and U.S. dollar strength also significantly impact Bitcoin. A stronger dollar or higher interest rate environment typically reduces risk appetite, which can pressure crypto markets.
On-chain data, including exchange inflows and wallet activity, also provides insight into investor behavior. Rising exchange deposits often indicate potential selling pressure, while accumulation trends suggest long-term confidence.
Institutional Flows and ETF Impact on Bitcoin Price
Institutional flows have become a dominant force in shaping the Bitcoin price trajectory. Exchange-traded funds and large asset managers now account for a significant portion of demand.
When inflows slow down, Bitcoin often enters consolidation phases. Conversely, strong inflows tend to support bullish momentum. The current environment reflects a more balanced but cautious flow pattern, contributing to market uncertainty.
Macro Conditions and Risk Sentiment
Global macro conditions continue to influence Bitcoin price action. Risk assets tend to perform better in low-interest-rate environments, while tighter monetary policy can suppress speculative demand.
At present, traders are closely monitoring inflation trends and central bank signals. Any shift toward tighter financial conditions could increase pressure on Bitcoin, reinforcing bearish technical signals.
Bull vs Bear Scenario for Bitcoin Price
The current Bitcoin price outlook can be divided into two main scenarios: bullish continuation or bearish correction.
Bullish Scenario for Bitcoin Price
In a bullish case, Bitcoin stabilizes above key support levels and recovers momentum. A rebound in RSI combined with a reversal in SMA structure could invalidate bearish signals.
If buying pressure returns, Bitcoin could resume its upward trend and break through resistance zones, reducing the likelihood of a drop toward $75K.
Bearish Scenario and the $75K Target
In a bearish scenario, continued RSI weakness and confirmed SMA crossover could trigger further downside pressure. This would increase the probability of a move toward $75K as the next major support zone.
In this case, the Bitcoin price correction would likely be driven by a combination of technical breakdowns and reduced liquidity support.
Trader Strategies in the Current Bitcoin Price Environment
In uncertain market conditions, traders often adopt flexible strategies focused on risk management. The Bitcoin price volatility requires careful position sizing and attention to key support and resistance zones.
Many traders wait for confirmation signals rather than predicting direction prematurely. This includes watching for RSI reversals, volume spikes, and structural breakouts before committing to major positions.
Risk Management in Bitcoin Price Volatility
Effective risk management is essential in the current Bitcoin trading environment. Volatility can lead to rapid price swings in both directions, making leverage particularly dangerous.
Traders often use stop-loss levels near key technical zones to protect capital. Diversification and gradual entry strategies are also commonly used to manage uncertainty during potential trend shifts.
Conclusion
The current Bitcoin price landscape is defined by uncertainty, with conflicting signals emerging from technical indicators and macroeconomic conditions. The potential SMA crossover and weakening RSI momentum suggest that bearish pressure is building, raising concerns about a possible move toward the $75K level.
However, Bitcoin remains a highly dynamic asset, and bearish signals alone do not guarantee a sustained downtrend. Strong support zones, institutional inflows, and macro shifts could quickly reverse sentiment and restore bullish momentum.
Ultimately, whether Bitcoin heads toward $75K or stabilizes depends on how price reacts around key support levels in the coming weeks. Traders and investors should closely monitor confirmation signals rather than relying on any single indicator.


 By covering these aspects comprehensively, this article meets diverse needs. It provides conceptual clarity for students and researchers, practical insights for professionals, and contextual background for enthusiasts. Such an approach increases engagement and ensures the content ranks well across a broad range of relevant search queries.