PENGU Crypto Rally Explained: What’s Fueling the Breakout

COIN4U IN YOUR SOCIAL FEED

The meme coin market is heating up again—and PENGU crypto is suddenly at the center of attention. After a period of relative silence, the token has begun showing strong upward momentum, attracting traders, influencers, and retail investors.

At first glance, this rally may seem like just another speculative spike. However, a closer look reveals that several powerful forces are aligning behind PENGU. From brand strength and community hype to broader market trends, this breakout may have more depth than typical meme coin pumps.

So, what exactly is driving the PENGU rally—and can it last?

What Is PENGU Crypto?

A Meme Coin With a Strong Brand

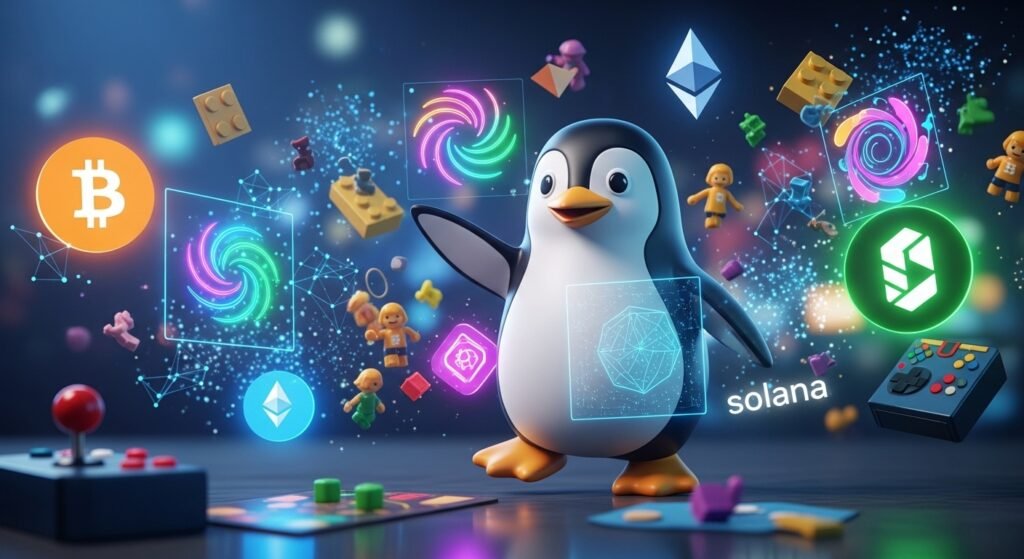
PENGU is the native token of the Pudgy Penguins ecosystem, originally launched as a viral NFT collection that evolved into a global Web3 brand. PENGU operates on the Solana blockchain and primarily functions as a community-driven token.

Unlike traditional cryptocurrencies, PENGU does not rely heavily on utility. Instead, its value comes from:

  • Cultural relevance
  • Community engagement
  • Brand expansion

In other words, it behaves more like a social currency than a traditional financial asset.

Why PENGU Is Pumping Right Now

1. Meme Coin Season Is Back

First and foremost, the broader crypto market is seeing a resurgence in meme coins.

Historically, when liquidity returns to the market:

  • Investors rotate into high-risk assets
  • Meme coins outperform major cryptocurrencies
  • Retail participation increases

Recently, tokens like PENGU have surged alongside other meme coins, reflecting renewed speculative interest.

2. Power of the Pudgy Penguins Brand

From NFTs to Mainstream Recognition

One of PENGU’s biggest advantages is its connection to a real-world brand.

Pudgy Penguins has expanded beyond crypto into:

  • Physical toys sold in major retail stores
  • Global brand recognition
  • Strong social media presence

As a result, PENGU benefits from mainstream exposure, something most meme coins lack.

Brand-Driven Value

Unlike many tokens, PENGU is tied to a growing intellectual property ecosystem.

Therefore:

  • Every brand expansion increases awareness
  • More users enter the ecosystem
  • Demand for the token can rise

3. Community Hype and Viral Momentum

The “Huddle” Effect

The PENGU community—often called “The Huddle”—plays a major role in price action.

In crypto, community strength often determines success, especially for meme coins.

Consequently:

  • Social media trends drive visibility
  • Memes fuel engagement
  • Viral content attracts new buyers

Speculation Amplifies Moves

Since PENGU has limited utility, its price is largely driven by sentiment and speculation.

This means:

  • Rallies can be fast and explosive
  • Corrections can be equally sharp

4. Solana Ecosystem Strength

PENGU operates on the Solana network, which has seen renewed growth in 2026.

Importantly:

  • Solana offers low fees and fast transactions
  • It has become a hub for meme coins
  • Increased activity boosts token visibility

Therefore, PENGU benefits from the broader momentum of the Solana ecosystem.

5. Airdrop and Distribution Effects

A large portion of PENGU tokens was distributed through airdrops to early users and NFT holders.

As a result:

  • Many holders acquired tokens at low cost
  • Early adopters actively promote the project
  • Liquidity increases during rallies

6. Narrative: NFTs + Memecoins + Real-World Products

PENGU sits at the intersection of three powerful narratives:

  • NFT culture
  • Meme coin speculation
  • Real-world brand expansion

This combination is rare.
Therefore, it gives PENGU a unique position in the market.

Can the Rally Continue?

Bullish Case

PENGU could continue rising if:

  • Meme coin momentum remains strong
  • The Pudgy Penguins brand expands further
  • Retail interest keeps increasing

In this scenario, the token could see sustained growth.

Bearish Risks

However, there are significant risks:

  • Lack of fundamental utility
  • High dependence on hype
  • Extreme volatility

Additionally, meme coin rallies often fade quickly once attention shifts.

How PENGU Compares to Other Meme Coins
PENGU Compares to Other Meme Coins

Similarities

Like other meme coins:

  • It relies on community sentiment
  • It benefits from viral trends
  • It experiences rapid price swings

Key Difference

However, PENGU stands out because of its real-world brand integration.

Unlike purely speculative tokens:

  • It has physical products
  • It has cultural recognition
  • It has a growing ecosystem

What Traders Should Watch Next

Key Indicators

To evaluate the rally, traders should monitor:

  • Trading volume spikes
  • Social media engagement
  • Solana ecosystem activity
  • Overall crypto market sentiment

Market Conditions Matter

Importantly, PENGU’s performance depends heavily on:

  • Bitcoin’s trend
  • Altcoin season strength
  • Liquidity conditions

The Bigger Picture: Rise of Cultural Tokens

PENGU represents a broader trend in crypto:
the rise of “cultural currencies.”

Instead of utility, these tokens derive value from:

  • Attention
  • Community
  • Brand identity

Therefore, they reflect a shift in how value is created in the digital economy.

Conclusion

PENGU crypto’s breakout is not happening in isolation. Instead, it is the result of multiple converging factors—meme coin momentum, strong branding, community hype, and Solana ecosystem growth.

While the rally could continue in the short term, it remains highly speculative.
Ultimately, PENGU’s long-term success will depend on whether it can evolve beyond hype and build sustainable value.

Explore more articles like this

Subscribe to the Finance Redefined newsletter

A weekly toolkit that breaks down the latest DeFi developments, offers sharp analysis, and uncovers new financial opportunities to help you make smart decisions with confidence. Delivered every Friday

By subscribing, you agree to our Terms of Services and Privacy Policy

READ MORE

Brandt Shows Bitcoin Has Violated Its Parabolic Advance, Major Correction Looming?

Bitcoin

COIN4U IN YOUR SOCIAL FEED

Bitcoin has a unique way of turning chart patterns into market-moving headlines. Veteran trader Peter Brandt knows exactly which lines the market fears most. When he indicates that Bitcoin has violated its parabolic advance, the implication is more than a simple price dip; it signals that the trend’s character may have changed. Parabolic moves often feel unstoppable, yet when momentum fails, they can punish complacency severely. This raises one of crypto’s most debated questions: is a major correction looming, or is this just a temporary shakeout to scare late buyers?

Brandt’s warning highlights a historical rhythm he observes in Bitcoin bull cycles. According to him, once Bitcoin breaks a dominant parabola, subsequent drawdowns have historically reached 70% to 80%. While Bitcoin currently trades near the high-$80,000s, the idea of a significant decline in the mid-$20,000s sparks debate and careful analysis. In this article, we will break down what a violated parabolic advance truly means, why it can precede major corrections, and how investors and traders can manage risk intelligently without succumbing to fear or greed.

Understanding the Parabolic Advance in Bitcoin

A parabolic advance describes a trend phase where Bitcoin price rises along a steepening curve. Early stages are gradual, but as excitement builds, leverage increases and buying intensifies. On charts, it appears as a smooth arc that becomes increasingly vertical. Often, these parabolas coincide with bullish narratives, such as ETF enthusiasm, halving expectations, liquidity expansion, or retail investor participation. Every dip seems like a buying opportunity—until momentum breaks.

When Peter Brandt signals a parabolic advance violation, he refers to Bitcoin falling below the trendline guiding the uptrend. Historically, breaks of dominant parabolas often precede sharp corrections. The violation does not guarantee a crash but shifts the probability distribution: the market moves from “trend intact” to “trend damaged,” expanding potential downside scenarios.

It is crucial to note that a violated parabola does not imply Bitcoin is “dead.” Instead, it signals that the rate of ascent has failed, potentially leading to consolidation or swift declines, depending on liquidity, market sentiment, and technical support levels.

Why Parabolic Trends Often Break Violently

Parabolic advances attract emotionally reactive buying. Late entrants chase the trend, early holders take profits, and leveraged positions increase risk. The structure becomes fragile: if Bitcoin slips below the parabola, confidence can flip to caution and then to panic. Historical patterns confirm that breaking a dominant parabolic curve can trigger violent corrections, making Brandt’s warning particularly relevant.

What a “Major Correction Looming” Actually Means

Major Correction Looming

The phrase “major correction looming” varies with perspective. For a long-term investor, a correction may be a 30% decline. In Bitcoin terms, historical corrections can exceed 50%, consistent with previous bull-cycle volatility. Brandt’s view focuses on the extreme end: post-parabola drawdowns approaching 75–80%.

The psychological impact of his warnings is significant. Market participants often respond immediately, whether by selling, hedging with derivatives, or waiting for confirmation. Brandt’s thesis is conditional: it assumes that the current parabola represents the dominant trend and that its violation is comparable to past cycles. If these conditions hold, a major correction scenario becomes credible.

Why the $25K–$26K Target Generates Headlines

Applying historical drawdowns to Bitcoin’s recent peak produces mid-$20,000s targets. These figures attract attention because they are specific, dramatic, and easily shared. Investors should treat these as scenario planning tools rather than absolute forecasts. Scenario analysis is useful for stress-testing portfolios, not dictating decisions.

Current Bitcoin Price and Its Implications

Bitcoin trades near the high-$80,000s, which amplifies fear of large drawdowns. A potential 70%+ correction seems threatening to recent buyers and the broader bullish narrative. Context matters: if Bitcoin regains key parabolic levels and holds, the violation may be temporary. If it forms lower highs and lower lows while breaking major supports, the bearish thesis strengthens. The violation primarily signals a shift in risk regime rather than a predetermined price path.

Volatility, Liquidity, and Parabolic Breakdowns

Volatility is a defining feature of Bitcoin. During parabolic moves, volatility can compress, but a break in the curve often expands volatility, amplifying selling pressure. Liquidity is also critical: supportive macro conditions can absorb selling, while tightening liquidity can exacerbate declines. Sharp, fast corrections often follow parabolic breaks, especially when market bids are thin or leveraged positions unwind.

Technical Signals Supporting Brandt’s Thesis

Key indicators include sustained failure to reclaim the broken parabola, formation of lower highs and lower lows, decisive breaks of psychological supports, and rapid, repeated declines. These technical signals can confirm whether a “major correction looming” scenario is unfolding. The emphasis is on pattern recognition and confirmation rather than one-off price dips.

Pullback vs. Cycle-Ending Breakdown

A pullback is a temporary retracement in an ongoing trend. A cycle-ending breakdown represents a structural shift into a prolonged downtrend or deep bear market. Brandt’s warning leans toward a potential cycle-ending scenario, but confirmation requires time, repeated failures, and careful observation of market structure.

Counterarguments: Not All Parabolic Violations Lead to Doom

Not every parabola break results in catastrophe. Bitcoin’s market structure, participation, and institutional involvement differ from earlier cycles. Parabolic violations can trigger long consolidations rather than deep corrections. Analysts may even redraw trendlines, altering interpretations. Behavioral dynamics—temporary leverage flushes followed by recovery—also highlight why caution and confirmation are key.

Macro and On-Chain Context

Macro conditions, such as interest rates, risk asset performance, and liquidity, influence whether Bitcoin stabilizes after a break. On-chain data can provide insight into holder behavior and exchange balances, helping distinguish between long-term accumulation and short-term leverage unwinding. Using this context alongside technical analysis improves decision-making.

Managing Risk Without Panic

Educations

Traders and investors should avoid emotional reactions to headlines. Risk management includes reducing leverage, adjusting invalidation points, reviewing exposure sizing, and respecting time horizons. A violated parabola is a reminder that upside trends can break faster than they climb, reinforcing the need for disciplined portfolio planning.

The Role of Timeframes

Brandt’s signals are more relevant on longer timeframes. Short-term traders might overreact to intraday noise. Aligning responses with intended investment horizons prevents premature or misguided decisions.

What a Major Correction Could Look Like

A large correction typically occurs in phases: initial break, reflex rally, second leg down if the rally fails, followed by a period of accumulation or sideways consolidation. While the exact path is uncertain, awareness of potential scenarios helps traders and investors plan for volatility.

Conclusion

Peter Brandt’s observation that Bitcoin has violated its parabolic advance serves as a reminder of past patterns. While a “major correction looming” scenario is credible based on historical cycles, it is not guaranteed. Market reactions, liquidity, macro conditions, and investor behavior will determine the next phase. The key takeaway is that parabolic phases are fragile, and the smartest participants respond with disciplined risk management, clear time horizons, and respect for Bitcoin’s unpredictability.

FAQs

Q: If Brandt shows Bitcoin has violated its parabolic advance, does that automatically mean a major correction is guaranteed?

A parabolic advance violation signals a broken trend, not a certainty of a crash. Historical cases show deep drawdowns can follow, but Bitcoin may consolidate, recover, or form new structures depending on liquidity, sentiment, and follow-through price action.

Q: Why do parabolic advance breaks often lead to violent moves and headlines about a “major correction looming”?

Late-stage parabolic buying, high leverage, and emotional conviction create fragile structures. When the curve breaks, forced selling and liquidation cascades can turn a normal pullback into a sharp correction, particularly in a volatile market.

Q: What confirmation signals should traders watch after a parabolic advance violation?

Key confirmations include repeated failures to reclaim the broken parabola, lower highs and lower lows, and decisive breaks of major supports on higher timeframes. Weak bounces and continued downward structure reinforce a bearish thesis.

Q: How can long-term investors respond without panic-selling?

Investors should reassess position sizing, time horizon, and downside tolerance. Prioritizing risk management and planning for potential drawdowns allows for consistency during volatile periods.

Q: Could Bitcoin still rise after a parabolic advance violation?

Yes, broken parabolas can lead to deep corrections, long consolidations, or structural resets that later support another expansion phase. Separating short-term risk from long-term adoption narratives is essential for perspective.

Explore more articles like this

Subscribe to the Finance Redefined newsletter

A weekly toolkit that breaks down the latest DeFi developments, offers sharp analysis, and uncovers new financial opportunities to help you make smart decisions with confidence. Delivered every Friday

By subscribing, you agree to our Terms of Services and Privacy Policy

READ MORE

ADD PLACEHOLDER