

























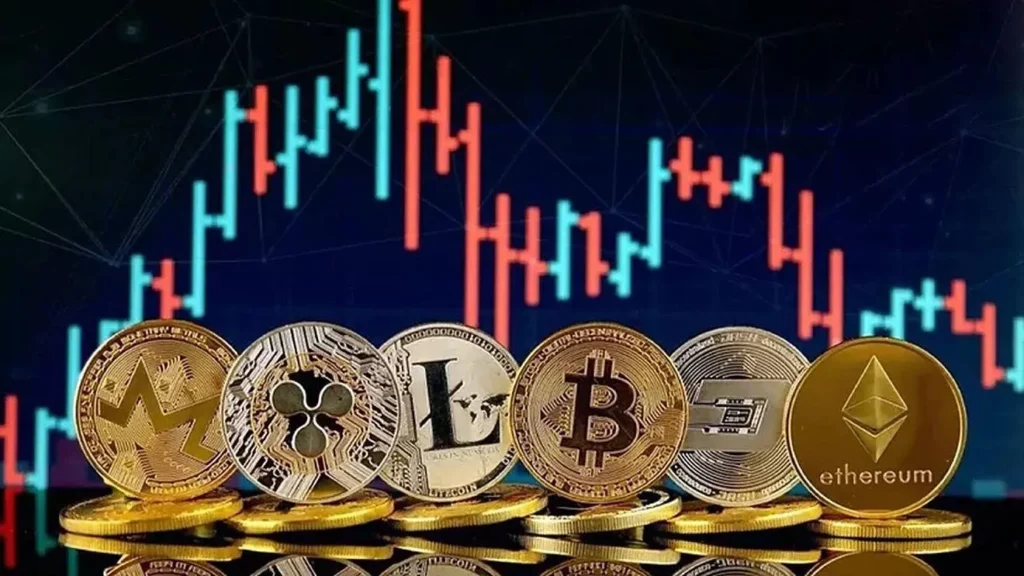
10 Crypto Exchanges with the Lowest Fees (Oct 2025)

10 Crypto Exchanges

COIN4U IN YOUR SOCIAL FEED

If you trade often, fees can quietly erode your returns. A difference of just 0.10% per trade adds up fast for active spot and futures fees traders, market makers, and arbitrageurs. That’s why a clear, monthly-updated comparison of the crypto exchanges with the lowest fees is essential. In this October 2025 guide, we break down base spot trading fees, maker–taker fees, VIP tier discounts, token-based fee cuts, and limited-time promotions that can push your effective rate toward zero. Where a platform publishes updated changes—like region-specific pricing in the EEA or seasonal discounts—we call those out and link to official schedules so you can verify the numbers yourself.

A quick refresher: most exchanges use maker–taker fees. Makers add liquidity with resting limit orders and usually pay lower or even negative fees at high tiers; takers remove liquidity by crossing the spread with marketable orders and usually pay a bit more. Your “real” cost is your posted rate minus any VIP tier reductions, “pay-fees-with-our-token” discounts, and maker rebates. Many platforms further differentiate spot trading fees from derivatives: perpetuals and options often have separate ladders with tighter maker rates and higher taker rates.

Below you’ll find the 10 most cost-efficient, mainstream exchanges right now—picked for their globally competitive pricing, liquidity, and transparent fee pages. For each, we summarize the entry (base) rates, popular discounts, and what it actually means for your pocket in October 2025.

How do we compare “lowest fees” fairly

We focus on three things. First, the published base maker–taker rates at the entry tier (what you’ll see before hitting VIP volume). Second, widely available discounts, such as paying in the native token (BNB, OKB, BGB, MX, etc.) or buying “points.” Third, current promos and region-specific adjustments that meaningfully change effective rates. Because fee tables change, we link to the latest official schedules or credible, recent breakdowns so you can double-check live numbers on the day you trade. For example, Binance maintains an always-on trading-fee schedule and highlights VIP tiers; OKX recently updated its fee structure for EEA users effective October 1, 2025; and MEXC is running limited 0% futures fees on specific contracts this month—these details can shift your effective cost this week, not just “on average.”

Binance: deep liquidity and easy discounts
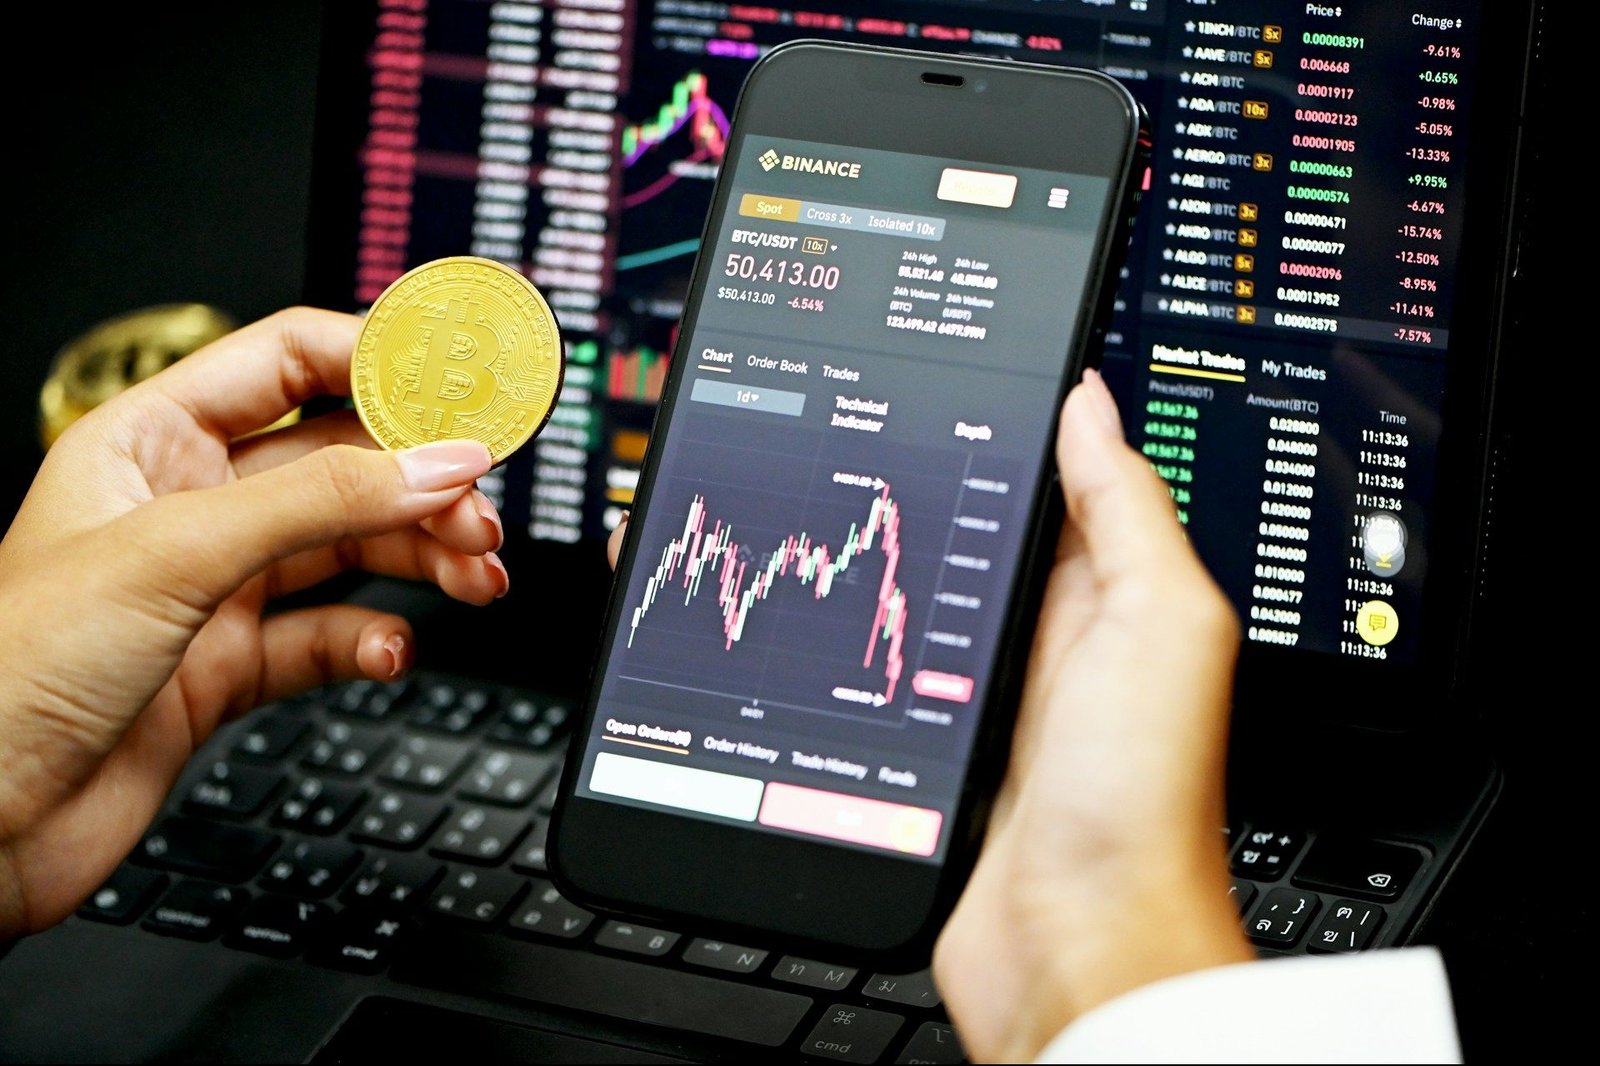
Binance: deep liquidity and easy discounts

Binance’s base spot trading fees typically start at 0.10% maker / 0.10% taker, with a widely used 25% discount when you pay fees in BNB. That drops the effective spot fee to roughly 0.075% at the entry level, and further reductions apply as you climb VIP tiers by 30-day volume. Binance’s live fee schedule lays out spot, margin, and convert, and the VIP ladder updates automatically with your rolling volume. For a frequent trader, that BNB discount alone is often the difference between average and best-in-class effective rates.

Why it’s among the crypto exchanges with the lowest fees: entry-level 0.10% is already competitive, but the BNB reduction and VIP scaling push costs down further without complicated hoops. If you mostly execute taker orders, factor the BNB discount into your calculations—it meaningfully narrows the gap to maker pricing.

OKX: aggressive base pricing and region-specific updates

OKX has long been a low-fee favorite thanks to slim base maker/taker rates and OKB-based discounts. This month, OKX also rolled out an updated fee structure for EEA users effective October 1, 2025, which is worth reviewing if you reside in that region. Several current guides show base spot tiers starting around 0.06% for both maker and taker, with volume and OKB holdings reducing costs as you scale up. Always confirm the exact rate for your region and tier on the official page before you trade.

Why it’s among the lowest: low entry-level spot trading fees, transparent VIP tiers, and additional OKB discounts mean OKX regularly competes for the absolute cheapest fills—especially for active traders who can unlock higher tiers.

Bybit: lean spot fees and competitive derivatives

Bybit keeps spot trading fees tight, and its derivatives ladder is especially attractive if you primarily trade perpetuals. The exchange’s official fee structure and recent explainers outline maker/taker for spot, perpetuals, futures, and USDC options, plus VIP-based reductions and promotional discounts that come and go. If you’re comfortable with Bybit’s product set, the combination of low spot fees, liquid perps, and occasional promos makes it easy to keep effective costs low across a multi-market workflow.

Why it’s among the lowest: lean base maker–taker fees on spot, very competitive futures fees, and regular fee events that cut taker costs when you need to cross the spread.

KuCoin: broad markets with familiar 0.10% spot and token cuts

KuCoin’s fee framework mirrors the industry’s best-known pattern: a base spot trading fee around 0.10% for both maker and taker, with VIP tiers and KCS-based discounts to lower costs. Its support docs reiterate the maker–taker model and set expectations on how lower “maker” pricing rewards you for adding liquidity. For traders who value a large altcoin roster, KuCoin’s mix of markets and predictable fee ladder keeps it firmly in the “low-cost” camp.

Why it’s among the lowest: a simple, familiar 0.10% starting point, plus KCS/VIP reductions, makes KuCoin a strong value, especially if you’re placing resting limit orders to clip maker rates.

MEXC: low base, token perks—and 0% futures promos this month

MEXC’s public fee page highlights the ways holdings of MX token can trim both spot trading fees and futures fees. More importantly for October 2025, MEXC is running a limited-time 0% futures promotion on selected contracts (regional scope specified in the announcement) from October 16–31, 2025. If you’re eligible, that can bring your effective taker cost to zero on those pairs for the rest of the month, which is as low as it gets. Outside promos, MEXC’s base maker–taker is already competitive, and VIP tiers add leverage for active accounts.

Why it’s among the lowest: aggressive promotions and MX-linked discounts can make MEXC a top pick for cost-minimizing derivatives traders right now.

Bitget: straightforward 0.10% spot and discounted with BGB

Bitget’s support material lays out clear figures: spot maker–taker at 0.10% with a discount to 0.08% when paying in BGB, and competitive futures fees that start at 0.02% maker / 0.06% taker—then shrink with VIP volume. If your strategy is taker-heavy in perps, 0.06% is already decent at entry; if you can post liquidity on the maker side, 0.02% can meaningfully increase your edge, especially for high-frequency or grid-style approaches.

Why it’s among the lowest: the combination of token-based spot discounts and a tight derivatives ladder makes Bitget one of the cheapest “all-rounders” for mixed spot and futures fees.

Gate.io: points can drop effective taker fees sharply

While some reviews quote Gate.io’s legacy 0.20% spot number, today’s fee page shows that buying “points” meaningfully reduces your effective rate. With points, the base taker rate starts at 0.075%, and the platform explains how maker rebates and point costs can push the effective taker fee down even further, depending on your activity and VIP level. If you’re optimizing for taker-dominant execution, Gate’s points system deserves a look instead of judging solely by the older 0.20% headline.

Why it’s among the lowest: after accounting for points and maker rebates, effective spot trading fees can undercut many rivals—particularly for high-activity accounts that can amortize point costs.

Phemex: simple 0.10% spot, 0.01% maker on contracts

Phemex publishes a clean breakdown: spot trading fees of 0.10% for maker and taker, while contracts start at 0.01% maker / 0.06% taker. There’s also a Market Maker Incentive Program that can pay a maker rebate up to 0.005% if you qualify, plus VIP tiers that reduce both spot and derivatives costs. For traders who can reliably post liquidity, the 0.01% contract maker rate is attractively low at entry.

Why it’s among the lowest: low contract maker–taker fees right out of the gate, with a rebate path for participants who can provide liquidity at scale.

BingX: flat 0.10% spot, tight 0.02%/0.05% futures at base

BingX’s current overviews make it easy to price your strategy: spot sits at 0.10% maker/taker, and base futures fees are often quoted around 0.02% maker / 0.05% taker. That’s a lean ladder for contract traders, and, combined with a straightforward spot rate, puts BingX in the value tier for active users who don’t want to decode complex fee tables. Always verify the pair-level fee when you open a new market, as some symbols can vary.

Why it’s among the lowest: consistent, low base pricing across spot and contracts with minimal friction to unlock those numbers.

CoinEx: competitive tiers and market-maker rebates

CoinEx: competitive tiers and market-maker rebates

CoinEx has been tightening its schedule for both spot and perps. Recent announcements show tiered improvements, including maker rebates for high-ranking market makers on spot and futures, while VIP 0 derivatives rates often start around 0.03% maker / 0.05% taker. Spot fees can be reduced via volume and CET-based discounts, and market makers can achieve 0% or even negative maker fees on certain tiers. If you’re an algorithmic trader providing liquidity, that rebate structure can flip fees from a cost to a revenue line.

Why it’s among the lowest: meaningful market maker rebate potential and competitive base futures fees give CoinEx one of the more attractive cost profiles if you trade programmatically.

Kraken, Coinbase, and why they’re not in this month’s “lowest” list

Kraken and Coinbase Advanced are robust, regulated options with excellent security and fiat ramps, but their entry-tier maker–taker fees are generally higher than the ten platforms above. If your priority is absolute lowest cost at low volumes, the exchanges listed earlier typically beat them on base pricing; if regulation, fiat on/off ramps, or specific jurisdictions matter more, Kraken and Coinbase Advanced remain strong choices—just know you might pay more at the start. Always check each platform’s live fee table to see whether your current monthly volume qualifies you for better tiers.

Regional pricing, token discounts, and promotions: the fine print that changes everything

A universal rule in 2025: always read the regional footnotes. OKX, for instance, updated maker–taker fees for EEA users effective October 1, 2025—terms like these matter if you travel or relocate. Similarly, token-based reductions (BNB on Binance, OKB on OKX, BGB on Bitget, MX on MEXC) materially change your effective spot trading fees—often by 20–25% at entry—so run the math on whether holding that token fits your risk tolerance. Finally, promotions can compress your cost to zero or near zero for short windows; MEXC’s 0% futures fees on selected contracts this month is a live example worth checking if you’re eligible.

How to actually pay less in October 2025 (without over-optimization)

If you mostly take liquidity, prioritize platforms with taker discounts you can realistically unlock—BNB/OKB/BGB or points. If you can post liquidity, seek exchanges with low or rebated maker rates. On derivatives, base ladders of 0.02%/0.05% or 0.02%/0.06% are already good; combining maker posting with VIP volume can push effective futures fees toward zero. And remember the “hidden” line item: withdrawals. While this article focuses on trading fees, withdrawal fees, and network costs can dwarf small differences in spot trading fees if you move funds often. Always check each market’s coin- and network-specific withdrawal table before you size up positions.

See More: Best Cryptocurrency Trading Platform 2025 Top 10 Exchanges Reviewed

Exchange-by-exchange fee snapshots (October 2025)

Binance

Base spot trading fees of roughly 0.10% maker / 0.10% taker, with a 25% BNB discount bringing the effective rate down to ~0.075% at entry; additional VIP tiers reduce costs further as your 30-day volume rises.

OKX

Low base pricing (often around 0.06%) with volume- and OKB-linked discounts. Note the EEA fee update in force from October 1, 2025—check your local schedule.

Bybit

Lean maker–taker fees across spot trading fees and perps, plus periodic promotions and VIP tiers that narrow taker costs for active accounts.

KuCoin

Familiar 0.10% based on spot for maker and taker, with reductions via VIP ladders and KCS benefits, making it cost-friendly for altcoin specialists.

MEXC

Competitive base rates, MX-token discounts, and this month’s regional 0% futures fees promo for selected contracts through October 31, 2025.

Bitget

0.10% spot at base, dropping to 0.08% when paying in BGB; futures fees typically 0.02% maker / 0.06% taker with VIP-driven reductions for high-volume traders.

Gate.io

Don’t stop at the legacy 0.20% headline; with “points,” the base taker rate lists at 0.075% and may be driven even lower when combined with maker rebates and VIP levels.

Phemex

Straightforward 0.10% spot trading fees and contract maker–taker of 0.01% / 0.06%, with a market-maker program offering up to a 0.005% maker rebate for qualified users.

BingX

Simple 0.10% spot and base futures fees around 0.02% maker / 0.05% taker, making it easy to model your cost without a maze of conditions.

CoinEx

VIP 0 derivatives around 0.03% maker / 0.05% taker, with tiered cuts and market-maker levels enabling 0% to negative maker fees on some schedules—compelling for liquidity providers.

Conclusion

In October 2025, the crypto exchanges with the lowest fees share the same DNA: tight maker–taker fees on spot, sub-0.06% futures fees for makers, transparent VIP ladders, and tangible token or points discounts. The biggest wins come from three habits. First, always check the live, region-specific fee page before you trade; base tables change and promos are time-boxed.

Second, align your execution style with the right discount—BNB/OKB/BGB for takers, or market maker rebate programs and maker-friendly ladders if you can post size. Third, re-run the math monthly: a small bump in 30-day volume, an extra token balance, or a short-term promo can shave basis points you’ll actually feel over hundreds of fills. With the ten platforms above, you can build a fee-efficient stack whether you do a few swings a week or thousands of micro-fills a day.

FAQs

Q: What are maker–taker fees, and why do they matter?

Maker–taker fees are how exchanges price trades. Makers add liquidity with resting limit orders and generally get lower (even negative) fees; takers remove liquidity with marketable orders and pay slightly more. Over time, selecting an exchange with lower taker rates (if you cross the spread) or a strong market maker rebate (if you post) can materially improve performance. For current examples and tables, see the official fee pages from Binance, OKX, and others linked in this guide.

Q: How do VIP tiers and token discounts actually reduce my cost?

Most platforms tie your fee tier to 30-day trading volume. Hitting higher tiers reduces your posted maker–taker fees. Separately, paying in the exchange’s token (BNB, OKB, BGB, MX) often grants a percentage discount on top of your tier. The combination can drop an entry-level 0.10% spot trading fee into the 0.06–0.08% range or lower, depending on the venue. Always confirm the live discount language on the fee page before you assume savings.

Q: Are there any genuine 0% trading fee opportunities right now?

Yes—temporarily. In October 2025, MEXC is advertising 0% futures fees on selected contracts through October 31 for certain regions. These windows are short, pair-specific, and geo-scoped, so read the announcement details to ensure you qualify.

Q: Which exchange is “cheapest overall” for a new trader?

There isn’t a single winner because it depends on your style. If you take liquidity on spot, look at Binance, Bitget, or Bybit with token discounts applied. Ouuu provides liquidity on Perps, Phemex, and CoinEx have attractive futures fees and market maker rebate pathways. If you’re in the EEA or SEA, check OKX and MEXC’s current region-specific updates and promos.

Q: Why aren’t Kraken or Coinbase Advanced in the “lowest fee” top 10?

They tend to have higher entry-tier maker–taker fees than the venues above. That said, both are excellent, regulated platforms with strong fiat ramps and liquidity—many traders happily pay slightly more for those strengths. If you scale into higher VIP tiers on either platform, your effective cost can still fall into a competitive zone. Review each platform’s live fee page for your current tier before deciding


Explore more articles like this

Subscribe to the Finance Redefined newsletter

A weekly toolkit that breaks down the latest DeFi developments, offers sharp analysis, and uncovers new financial opportunities to help you make smart decisions with confidence. Delivered every Friday

By subscribing, you agree to our Terms of Services and Privacy Policy

READ MORE

Ethereum Price Prediction Calm Before a Big Move

Ethereum Price Prediction

COIN4U IN YOUR SOCIAL FEED

If you have followed crypto for more than a minute, you already know that rallies rarely move in straight lines. Trends pause, momentum cools, and sentiment flips from euphoria to anxiety, sometimes in a matter of days. That is precisely the zone Ethereum finds itself in today. After a strong advance, ETH has slipped into a corrective phase that looks unnerving on short time frames, yet constructive when you zoom out. This article delivers a thorough, human-written Ethereum price prediction that treats the pullback not as a death knell but as a potential base for a larger move. We will unpack the macro forces, on-chain metrics, technical structure, Layer-2 scaling progress, and the evolving smart contract economy that together frame the next chapters for ETH.

Corrections are where markets “exhale.” They clear out excess leverage, reset funding rates, force complacent traders to the sidelines, and let long-term investors accumulate with less noise. When you align that market rhythm with Ethereum’s underlying fundamentals—ranging from staking dynamics to rollup adoption—the case for a storm after the calm begins to take shape. None of this is financial advice, and crypto remains volatile. But if you want a data-driven narrative that connects the dots, consider the sections below your field guide to ETH’s next act.

The Structure Behind a Healthy Correction

Why Pullbacks Are a Feature, Not a Bug

Every durable uptrend needs time to digest gains. In price discovery phases, momentum tends to overshoot, RSI stretches, and spot premiums open up relative to derivatives. A measured retreat lets those indicators normalize. For ETH, an orderly drawdown accompanied by declining open interest, easing funding rates, and rising spot exchange balances can signal that hot money is leaving while patient capital re-enters. That process builds durability for the next leg higher.

A second benefit of corrections is narrative calibration. As headlines cycle from “Ethereum to the moon” to “ETH is finished,” sentiment surveys often swing to pessimism at the exact moment on-chain activity improves. Transaction throughput, gas fees, and DeFi volumes can bottom before price does, laying the groundwork for a bullish divergence. When those divergences appear alongside structural tailwinds—like the expanding Layer-2 ecosystem—they often precede powerful breakouts.

The Anatomy of ETH’s Current Range

Most corrections resolve within a range defined by a prior breakout level and a recent swing high. For Ethereum price prediction analysis, watch the zone where prior resistance turned into support after the last rally. This area tends to attract limit orders from larger players who prefer to buy weakness, not chase strength. If price consolidates above that shelf while daily moving averages curl higher, the market often stages a retest of the previous high, and then explores new territory.

A decisive break below the base would change the thesis, of course. The key is not to guess but to observe: Is volume expanding on green candles? Are liquidity pools building underneath the price? Are long/short ratios stabilizing? Taken together, those clues help refine the odds that the “calm” is actually a coiling spring.

Fundamentals: The Engine Under ETH’s Hood

Fundamentals: The Engine Under ETH’s Hood

The Supply Story After Staking and Upgrades

Since The Merge, Ethereum switched to Proof of Stake, fundamentally altering issuance and burn dynamics. With base-fee burns via EIP-1559 and a growing share of the supply staked, ETH’s liquid float can tighten during periods of high usage. When network activity rises—think NFT mints, DeFi cycles, on-chain gaming, or stablecoin flows—fee burn increases, offsetting issuance and sometimes pushing ETH toward ultrasound money behavior. For a medium-term Ethereum price prediction, a constrained effective supply is a tailwind, especially when paired with stronger demand from builders and users.

Staking adds another dimension. Staked ETH is essentially removed from liquid circulation for as long as validators choose to participate. As staking penetration grows, the proportion of ETH available to trade on exchanges shrinks. In risk-on phases, that scarcity effect can amplify upside moves; in risk-off phases, it may soften the blow by reducing forced selling. Either way, the supply curve looks friendlier to long-horizon investors than it did in the proof-of-work era.

Demand Drivers: DeFi, NFTs, and Real-World Assets

ETH is not merely a speculative token; it is the native asset of the world’s largest smart contract platform. Demand grows with utility. During calm periods, we often see developers ship at a rapid clip: new AMMs, cross-chain bridges improving security models, RWA tokenization experiments, perpetual DEXs, and lending protocols optimizing collateral efficiency. Even if volumes dip during corrections, product market fit improves in the background. Over time, a deeper bench of protocols and use cases translates into steadier base demand for blockspace, which supports fee burn and, indirectly, the ETH bid.

Real-world assets deserve special attention. As tokenized treasuries, invoices, and even property titles migrate on-chain, the network effects compound. Ethereum’s standards, tooling, and composability give it a natural advantage as the default settlement layer for programmable assets. When institutions experiment with tokenization pilots, they often pick Ethereum or EVM-compatible chains first. That funnel expands the universe of users who ultimately need ETH to interact, hedge, or provide liquidity.

Where Throughput Meets Adoption

Scaling is no longer a theoretical roadmap. Optimistic rollups and zero-knowledge rollups now process a material share of total transactions. As Layer-2 usage increases, the effective capacity of the Ethereum ecosystem grows by orders of magnitude while anchoring security back to Layer-1. That means more transactions, lower average fees on rollups, and a better user experience—without compromising decentralization. The L2 stack’s maturation, plus anticipated upgrades like danksharding and proto-danksharding (EIP-4844), is central to any credible Ethereum price prediction because it links price to real utility expansion.

Importantly, L2s don’t make ETH obsolete; they make it more necessary. Sequencers post data to Ethereum, settle disputes to Ethereum, and rely on Ethereum’s cryptoeconomic guarantees. As L2 throughput rises, the base layer remains the root of trust. The endgame resembles an internet of rollups interwoven with Ethereum as the coordinating hub. In that world, ETH’s role as the primary collateral and settlement asset strengthens, not weakens.

Technical Outlook: Levels, Structure, and Probabilities

Trend, Momentum, and the “Coil”

On multi-month charts, ETH tends to move in impulsive waves followed by consolidations shaped like flags, triangles, or rectangles. When a consolidation lasts long enough to compress volatility, the next move often travels as far as the initial impulse—or farther—depending on volume confirmation. Traders look for higher lows, shrinking realized volatility, and Bollinger Band pinches to anticipate that expansion.

In the current backdrop, a corrective channel with repeated defenses of a well-defined support area suggests accumulation. If ETH holds that structure while daily RSI resets from overbought toward neutral and MACD flattens, a push through the channel top can target the prior swing high. Above that pivot, liquidity gaps may accelerate the price toward psychological round numbers. If the base fails, the next confluence zone—often near a rising 200-day moving average or a Fib retracement cluster—becomes the line in the sand for invalidation.

Market Internals to Watch

During this “calm,” monitor three internal gauges. First, derivatives positioning: declining open interest after a downside wick hints at liquidation events that clean the runway. Second, spot CVD (cumulative volume delta) on major exchanges: persistent spot buying against fading sell pressure often precedes breakouts. Third, stablecoin inflows.

When fresh stablecoin liquidity enters exchanges, it can foreshadow bid strength across majors, including ETH.If those internals turn in tandem while price remains within the consolidation, the probability of an upside resolution rises. Combine that with improving on-chain activity—like higher daily active addresses on L2s—and the bullish Ethereum price prediction gains credibility.

Macro Backdrop: Liquidity, Policy, and Risk Appetite

Macro Backdrop: Liquidity, Policy, and Risk Appetite

The Dollar, Rates, and Crypto Beta

Crypto does not trade in a vacuum. A softer U.S. dollar, steady or declining real yields, and easing financial conditions tend to support risk assets. When macro risk appetite improves, capital flows to growth stories—and Ethereum’s scaling arc is one of the strongest in the digital asset space. Conversely, spikes in volatility indexes or hawkish policy surprises can sap momentum. For ETH, the base case is that macro acts as a tailwind when it stabilizes rather than as a primary driver. The structural catalysts inside Ethereum often matter more over a 6–18 month horizon.

Regulatory Clarity and Institutional On-Ramps

Regulatory milestones remain a wild card but trend toward clarity. Each incremental approval for compliant crypto custody, broker-dealer frameworks, or ETF-like vehicles (where applicable) reduces friction for institutions. Whether through direct acquisition of ETH, staking-as-a-service, or exposure to EVM ecosystems, easier on-ramps expand the buyer universe. The market may not reprice that in a single session; instead, it seeps into valuations as allocators grow comfortable. For our Ethereum price prediction, this slow normalization acts like a rising tide under the surface.

On-Chain Signals: What the Data Whisper

Active Addresses, Fees, and Burn

A strong mid-cycle base often starts with subtle improvements in on-chain throughput. Look for a gentle rise in active addresses, stabilization in median fees on L2s, and upticks in fee burn during usage spikes. Because EIP-1559 ties fees to burn, a resurgence in activity mechanically reduces net issuance, tightening supply. If that burn coincides with calmer markets and increasing staking deposits, the float available for trading narrows—exactly the setup that can turn a correction into a springboard.

Exchange Balances and Long-Term Holders

Two more tells: declining exchange balances and unwavering long-term holder supply. When coins move from exchanges to self-custody, they are less likely to be market-sold on impulse. A plateau or drop in exchange reserves during a price dip often signals accumulation. Meanwhile, coins dormant for 6–12 months typically belong to holders with high conviction. The stickiness of that cohort can dampen drawdowns and amplify rebounds, especially when new entrants arrive via Layer-2 apps and need ETH to interact.

The Narrative Flywheel: Builders, Users, and Capital

Composability and the App Layer

Ethereum’s most underestimated advantage is composability. Protocols can be stacked like LEGO bricks—a lending market feeding a DEX, which feeds a derivatives venue, which feeds a yield optimizer. The result is a dense economy where innovations don’t live in silos. Each new primitive increases surface area for other builders, accelerating iteration. Even if token prices rest, the app layer keeps moving. When markets wake up, they find a richer ecosystem than before, which helps explain why ETH rallies can travel farther than skeptics expect.

The Consumer Experience

User experience used to be Ethereum’s Achilles’ heel. Gas fees were unpredictable, and transactions could lag during peak times. That is changing fast on rollups, where transactions settle in seconds at a fraction of the cost while inheriting Ethereum’s security guarantees. Wallets are adopting account abstraction, session keys, and smart wallets that enable seamless interactions. As the UX gap closes, the total addressable market expands—from crypto-natives to mainstream users. A better UX translates into more transactions, deeper liquidity, and more fees—key ingredients in any sustainable Ethereum price prediction.

See More: Ethereum Price Prediction: ETH May Beat Bitcoin in October

Scenario Analysis: Paths Out of the Calm

Bullish Continuation

In the bullish path, ETH continues to consolidate above prior resistance turned support, with volatility compressing and market internals turning constructive. A breakout above the range high triggers a quick move to retest the previous swing peak. If volume expands and derivatives remain disciplined, ETH explores new highs for the cycle. Catalysts include L2 transaction records, notable RWA tokenization launches, and improved DeFi TVL quality. The measured move target from the consolidation width adds to confidence, and a weekly close above that target invites a trend extension.

Constructive Chop, Then Lift-Off

In a neutral-to-constructive path, ETH spends longer in sideways chop, mirroring a macro environment that is neither overtly risk-on nor risk-off. On-chain trends grind higher, builders keep shipping, and the market “bores” participants into disbelief. Eventually, a catalyst—perhaps a major enterprise tokenization pilot or a high-profile consumer app on L2—kicks demand into a higher gear. Structural supply constraints do the rest. The rally begins when few expect it, lending it staying power.

Bearish Breakdown and Reset

In the bearish path, support fails on a decisive weekly close with heavy volume and rising exchange inflows. ETH revisits a deeper retracement cluster around long-term moving averages. While difficult emotionally, such resets often improve forward returns by flushing weak hands and creating attractive risk-reward zones for patient buyers. The invalidation for a bullish Ethereum price prediction would be a sustained breakdown below the range and a trend of lower highs and lower lows on weekly time frames, especially if accompanied by deteriorating on-chain usage.

Risk Management: How to Think, Not What to Buy

Time Horizons and Position Sizing

No price prediction is complete without a reminder about horizons and sizing. Short-term traders compete in a noisy arena; daily candles can flip the narrative in hours. Long-term investors, by contrast, focus on adoption curves, supply dynamics, and developer momentum. For the former, tight stop-loss rules and clearly defined invalidation levels are essential. For the latter, dollar-cost averaging through corrections and rebalancing near strength can smooth outcomes. Align approach to temperament; the market rewards consistency more than heroics.

Catalysts That Could Surprise

Surprises cut both ways. Positive shocks might include faster-than-expected danksharding milestones, regulatory clarity around staking services, or a flagship consumer application onboarding millions via Layer-2. Negative shocks could involve smart contract exploits, macro liquidity crunches, or policy changes that unsettle the risk landscape. Build a plan that acknowledges both tails, and remember that the most explosive moves often follow periods of deceptive calm—exactly where ETH may be resting now.

Why the Calm Can Precede the Storm

Corrections cleanse. They neutralize froth, calm indicators, and refocus the market on fundamentals. For Ethereum, those fundamentals—Proof of Stake, EIP-1559 burn, rising staking shares, expanding Layer-2 throughput, and a relentless builder culture—sketch a credible path to higher valuations over the medium term. Technicals support the case with a coiling consolidation, while on-chain signals hint at patient accumulation. Macros, for their part, are likely to amplify rather than define the next act. It is not hard to envision a scenario where the current calm gives way to a decisive break, catching underexposed participants flat-footed.

The operative word is “if.” If support holds, if internals improve, if utility expands, then the probability skew favors the bulls. The best Ethereum price prediction is not a single number, but a framework. Within that framework, today’s correction looks less like an ending and more like the quiet breath before a storm.

Conclusion

Ethereum’s pullback is tempting traders to overreact, but the deeper picture argues for patience. Supply dynamics look structurally supportive after the shift to Proof of Stake and ongoing fee burn. Demand has durable drivers in DeFi, NFTs, RWA tokenization, and the maturing Layer-2 ecosystem. Technicals resemble a classic volatility coil above prior resistance, while on-chain indicators and market internals hint at accumulation.

Macro conditions will sway the tempo, yet fundamental adoption is the underlying beat. No forecast is guaranteed, and risk management is non-negotiable. But if you connect the dots, the correction appears less like weakness and more like a foundation. In that light, the calm could indeed be the preface to a storm.

FAQs

Q: Is Ethereum’s correction a sign of a trend reversal?

A correction by itself does not signal a trend reversal. Healthy markets breathe in and out. If ETH holds above key support zones, shows higher lows on daily charts, and market internals like funding and open interest normalize, the odds favor a continuation rather than a breakdown. A weekly close below the base with heavy volume would challenge that thesis and force a reassessment.

Q: How do Layer-2 rollups affect Ethereum’s price outlook?

Layer-2 rollups expand throughput and cut costs while anchoring to Ethereum’s security. As more activity migrates to L2s, the ecosystem processes more transactions, improving user experience and broadening adoption. Because ETH remains the settlement and collateral asset, increased L2 activity ultimately supports demand for ETH and strengthens long-term price dynamics.

Q: What on-chain metrics should I watch during a consolidation?

Focus on active addresses, fee burn trends, exchange balances, and staking participation. Rising activity with stable or falling exchange reserves often signals accumulation. Also track derivatives metrics like open interest and funding rates; a reset there can clear the runway for the next leg higher.

Q: Could regulation derail the bullish case for Ethereum?

Regulatory shocks can inject volatility, but the long-term trajectory has been toward greater clarity. Clearer rules for custody, disclosures, and market structure typically expand institutional participation. While policy setbacks are possible, gradual normalization often increases the pool of buyers and deepens liquidity over time.

Q: What is a prudent strategy during the “calm” phase?

Align strategy with time horizon. Short-term traders can define invalidation levels within the range and avoid over-leveraging. Long-term participants might dollar-cost average on weakness, diversify across catalysts, and maintain dry powder for opportunities. In all cases, risk management and patience matter more than perfect entries.

Explore more articles like this

Subscribe to the Finance Redefined newsletter

A weekly toolkit that breaks down the latest DeFi developments, offers sharp analysis, and uncovers new financial opportunities to help you make smart decisions with confidence. Delivered every Friday

By subscribing, you agree to our Terms of Services and Privacy Policy

READ MORE

ADD PLACEHOLDER